How It Happened: Week Eight

The scorelines of the three games I caught this weekend had a very "binary solo" feel to them: 1-0, 1-1, 1-0. There were impressive performances from young wingers, outstanding goalkeeping, and irresponsible defending - and that was just in these three games. Here's how it happened for six teams last weekend. Columbus Crew 1 - 1 New York Red Bulls

Stat that told the story for New York: 5 terrific chances in the first 10 minutes

ny8

This was certainly the premier game I tuned into this weekend: two teams fighting to stay near the top of the Eastern Conference and who play entertaining soccer. Both teams played pretty well, too, for the most part - a notable exception was the first ten minutes when Red Bulls were terrific and Columbus was sleepwalking. NYRB would look back on these first ten minutes with great angst, as great saves by Steve Clark and near misses by Eric Alexander and Thierry Henry made them all go for naught. New York would eventually get their goal through the red-hot Bradley Wright-Phillips, but also gave up their share of great chances that required big saves from Luis Robles. All in all, this was probably a game where both teams left fairly content with the result and how they played.

Stat that told the story for Columbus: 7 first time crosses from wide players

I went over the game from both team's perspective above, so I'm going to use this space to talk a little general soccer strategy. Each and every game I ever watch, a wide player will receive a ball in the attacking third with forwards and attacking midfielders streaking into the box. And probably 80% of the time, the winger slows down and takes a touch to steady himself before crossing it, thereby forcing his teammates crashing the box to stop or delay their runs, and allowing the defense a chance to get set and defend the cross. Every time this happens, I get inexplicably angry. Crossing the ball with the first touch is admittedly more difficult and not always the right play, but it overjoys me to see Crew wingers (especially Hector Jimenez and Josh Williams) send in these first time crosses. Of the 23 the team recorded against New York, I counted 7 that were on the wide player's first touch. Oh, and the one that led to the team's lone goal? First time.

Montreal Impact 1 - 0 Philadelphia Union

Stat that told the story for Philadelphia: 15 giveaways in their own half by Union defenders

phi8


I used this stat for one of the games last week, and it's a bit of a tough one to quantify. I included the above image to show how I figure: 15 of the unsuccessful passes by Philly defenders ended in their defensive half (one of which led directly to the game's lone goal). For a team who have as impressive moments as the Union have early in the year, this kind of sloppiness out of the back really hurts. I don't want to heap all the criticism on Amobi Okugo, Sheanon Williams and the other defenders, because the truth is part of the problem stems from the midfield. As good as Maurice Edu and Vincent Noguiera look at times, there's often a conspicuous lack of anyone getting open in the middle of the field for the back line to pass to. The point is this: Philadelphia has certainly looked like a playoff team at times and probably deserves to have more points than they do, but at the same time are usually their own undoing.

Stat that told the story for Montreal: only 41 passes in attacking half by defense/midfield; 51 by four attackers

When watching the Impact this weekend, I was struck by the fact that four attackers in their formation were actually pretty creative and fun to watch. Jack McInerney, Marco Di Vaio, Felipe and Justin Mapp do a lot of good work interchanging and creating chances (especially on the counter). But their defense is fairly fragile, and because of that they play two central midfielders who concentrate on defending first and foremost. This leads to Montreal never really pushing up the field and keeping possession in the attacking half, which ends up putting a lot of pressure on them to defend for heavy minutes. This is one of many reasons that Montreal are near the bottom of the standings; on the other hand, those four attackers can be good enough to win some points on their own at times.

San Jose Earthquakes 1 - 0 Chivas USA

Stat that told the story for Chivas: 7/17 crosses completed by Leandro Barrera

chv8

Chivas had to be disappointed to lose this game. They outplayed the Earthquakes, particularly in the first half. They had more possession and more chances than San Jose on the whole, but they were really lacking in quality for the final ball/shot. A prime culprit on this was also one of their best players on the day, young electric winger Leandro Barrera. He mostly plays with the same strategy as guys like Fabian Castillo or Teal Bunbury; that is, run really fast past the defender and try to cross or shoot. Unfortunately, the end of that sequence is a struggle for Barrera: you can see from the image above that his crosses were as likely to fly well over the goal as they were to find a teammate in the box. If he can improve his service, Chivas should see an uptick in their goal scoring.

Stat that told the story for San Jose: 12 midfield recoveries + interceptions in the first half; 17 in the second

San Jose wasn't overly impressive in earning their first win of the year, but the second half was markedly better than the first. Admittedly, some of this was due to Chivas playing the last portion of the game down a man, but I think the largest reason for the second half improvement was the introduction of Yannick Djalo to the game. Bringing in a true wide threat stretched Chivas' midfield quite a bit, which was stocked with 3 center mids and two wide players who were wont to tuck inside. This led to the Goats controlling the midfield and winning a lot of balls in the first half, but they were spread thin and had a harder time in the second stanza. To wit: Chivas had 20 recoveries/interceptions to San Jose's 12 in the first half, but were out-dueled 17-14 by that measure in the second. Once Djalo is healthy, he needs to be on the field all game: it's clear that his presence brings a threat not only on the ball, but it also helps the team in other ways.


Agree with my ideas on these games? Think I'm an idiot? I love to hear feedback. @MLSAtheist


Week 9 PWP-Pick-List - My stunner this week? Columbus taking 3 at Sporting?!?

My thoughts on the Sporting v Columbus match a bit further down; for now let's get started working from left to right based upon kick-off times: Toronto entertains New England:  Toronto has been the odd one out in PWP this year and they've had injuries to go with - it doesn't appear that is the case this week.  Both teams are at full strength.  So how might this game go?  Will the Revolution 'turtle-up' in defense like they have in some other away games?  Toronto has been a side that is willing to yield large amounts of possession...  Normally the run of play drives the intent where one team will want to play  'keep-away' (sustain and maintain possession to increase better chances).  I'm not sure about this game though.  Without trying to be to cynical might this game be a game of 'hot-potato'; you take it - no you take it???    .... Probably not, but there's a fair chance that large chunks of this game will be start-stop with plenty of second chance balls and seeing-eye switches/through-balls/counterattacks against the run of play driving opportunities.  Or.... Nelson pulls a surprise with a possession based attack?   I don't know...  However that balances out I see Toronto taking three points - perhaps 2-1 as a final score?

Vancouver how to San Jose:  Have the earthquakes put themselves together now after that win versus Chivas - perhaps?  But enough to beat an aggressive Vancouver squad at BC Place - not likely.  Vancouver wins this - in my view what remains is how many goals they score against a slower San Jose defense.  If history has any say it'll be at least 2-1 Vancouver - my opine is the Whitecaps could score as many as three as the woes for San Jose continue.

Real Salt Lake travel to Chicago:  For some reason RSL struggles a wee bit in Chicago - in the last 5 matches RSL have never scored more than a goal but... this year may be different.  Chicago still don't have a strong defense and Jaoa Plata is back from injury for Real.  I see this game as being one of a few games where an away team will win this week.  Real Salt Lake are beginning to gel a bit better and as much as I like Chicago it's hard to see them taking three points against Real; RSL wins...

Colorado home to LA Galaxy:  This is a big test for the Rapids - especially after getting smacked down so badly in Seattle.  No major injuries or suspensions for either team and it's likely the team who has the edge in possession is the team who takes this one unless early goals signal a blowout.  The Galaxy are (if you can believe this) even more formidable in attack than Seattle and like the RSL v Chicago game I see this one being won by the away team - LA Galaxy wins - against the odds most likely.

Philadelphia travel to Seattle:  The Union are on a bad run of late - win-less in six while Seattle are simply pumping with energy since that come from behind 4-4 draw with Portland.   Can anyone stop the Sounders as they continue to pound their opponents of late?  With them in the friendly confines of Century Link Field and no major injuries (I'm aware of) to their top 12 or so it just doesn't seem likely the Union can come together to win this one.  Perhaps another multiple goal game for Seattle - but with a back-four that can be slow at times I don't think they get a clean sheet --- we'll see - Seattle wins.

Portland at home to DC United:  If you looked at this game before the season started you mighta thought this one a no-brainer; not so fast now though.  DC United are taking shape as a strong attacking team that is no slouch in defense.  My view here is this one is a battle of possession with the critical time being spent defending United crosses into the box on one side and finding the right striker to score on the attacking side.  Total possession percentage might not mean that much with two teams like this - what will matter most is the quality versus quantity issue in the Final Third.  The Timbers are beginning to show last year's habits and DC United are no where near the doormat this year.  I see this as a tight one but, really, can the Timbers afford to drop points at home again?  Even a draw here would be a big disappointment.  Timbers take three.

Chivas USA at home to Houston:  Two teams looking to change direction - Chivas can score and Torres has shown that.  The confidence of the Dynamo has to be shaky after getting hammered by New York and then turning around and dropping 2 points with that draw versus Portland.  All told neither team has a win in their last six games and a 'draw' is begging to be called here but I won't.   At the end of the day the team who attacks better, as whole, usually wins.  And so far this year Chivas have attacked better, as a team, than Houston.  Chivas Win...

FC Dallas at home to New York:  If there was ever a time to play Dallas it's now - they took a heavy and costly loss in DC United and New York are riding a wave that should remind many of how well they performed last year in winning the Supporter's Shield.  New York wins... especially with Diaz unlikely to start and Michel, as well as Loyd, on a red card suspension -- I just don't see the home team winning this game.

Sporting KC at home to Columbus:  Of all this games this weekend this is the biggest one I'd like to watch and THANKFULLY this one is on NBC Sunday afternoon 4:00 PM Eastern!  Columbus have been one of the stronger teams to start this year and even with 3 draws on the trot they remain at the top with Sporting one point behind.   The challenge for Sporting this game is who starts at center-back; if I recall Opara is still injured and Collin is on a red card suspension.  And with Columbus being one of the top attacking teams in MLS this year I'm seeing the Berhalter bunch take three points - though if putting money on this game a draw is more likely.

In closing...

In case you missed it I did some research on team defensive activities this past week and after 71 games teams who average more Clearances, Interceptions and Blocked Crosses generate more Unsuccessful Passes against their Opponent's and are more likely to win... so if you get a chance today watch the wings and hopefully your team will do a better job in those key performance areas.

So far I'm at 44% and staying there will be a challenge given I'm not offering up draws anymore - a team might consider a draw a great result but no-one goes into a game with a plan that expects to get a draw as an outcome.  Only the game state as the game is played might drive decisions that push for one point instead of three...

Best, Chris

"Hurried Passes" - Could this be a new Statistic in Soccer?

Aye... the NFL track 'hurried throws' -  why doesn't a Statistics agency involved in Soccer track "Hurried Passes"? I'll get to that but first I need to set some conditions.

If you've read my article on Expected Wins  (XpW) it seems reasonable that a teams' Passing Accuracy in the Final Third has great value in working towards generating quality shots taken that are more likely to be on goal and (therefore) more likely to go in.

So what activities does the defense take to mitigate successful passes (i.e. generate Unsuccessful Passes)?

Before digging in, I'm not the only one on American Soccer Analysis looking into Defensive Statistics; Jared Young has put together an interesting article on Individual Defensive Statistics that may be of interest.

Similarities in our work come from collecting 'like' defensive activities; Tackles Won, Clearances, Interceptions, etc...

Additional twists in my efforts will be to fold my Opponent team attacking statistics in with my team Defense Activities to see what correlations might be present.

My data comes from the first 71 games in MLS this year (142 events) and my source is the MLS Chalkboard.

Bottom line up front (BLUF) - however this data plays out it needs to make sense so here's my operating conditions on Team Defensive Activities in the Defending Final Third and which ones I will focus on that can be associated with an Unsuccessful Pass in the Final Third:

  1. Recoveries - usually associated with 'loose balls' generated from some other activity like a deflection, rebound, or perhaps an unsuccessful throw-in that hits a head and deflects away (uncontrolled) that another player latches on to and then makes a move showing control the ball.  Therefore Recoveries are not counted as a specific defensive activity that would impede a successful pass - it is the resultant of another activity that impedes a successful pass.
  2. Clearances - one of the better examples of a defensive activity that impedes a successful pass - especially those generated from crosses but not necessarily called a blocked cross.  Therefore Clearances will be counted as a specific defensive activity that impedes a successful pass.
  3. Interceptions - pretty much self explanatory - an interception impedes a successful pass - therefore Interceptions will be counted as a specific defensive activity that impedes a successful pass.
  4. Tackles Won - this is a defensive activity that strips the ball from an opponent - so it is a possession lost but not a defensive activity that impedes a successful pass.  It won't be counted as a defensive activity that impedes a successful pass.
  5. Defender Blocks - this is a defensive activity that blocks a shot taken not a successful pass; therefore it won't be counted as a defensive activity that impedes a successful pass.
  6. Blocked Crosess - clearly it is what it is; and since a cross is a pass it will be counted as a defensive activity that impedes a successful pass.

To summarize - Blocked Crosses, Interceptions and Clearances will be counted as defensive activities that should impact the volume of Unsuccessful Passes.

So what are the correlations between those combined Defensive Activities versus Unsuccessful Passes after 142 events?

Final Third Defensive Activities to Unsuccessful Passes = .6864

Final Third Defensive Activities to Unsuccessful Passes when the Defending Activities' Team Wins = .7833

Final Third Defensive Activities to Unsuccessful Passes when the Defending Activities' Team Draws = .6005

Final Third Defensive Activities to Unsuccessful Passes when the Defending Activities' Team Loses = .6378

In conclusion:

It seems pretty clear that Teams who win have more Defensive Activities, that in turn increase their Opponents' Unsuccessful Passes given the higher positive correlation than losing teams - in other words a team that wins generally executes more clearances, interceptions and blocked crosses to decrease the number of Successful Passes their Opponents make.

It also seems pretty clear that all those Defensive Activities don't account for the total of Unsuccessful Passes generated by the Opponent.  If they did then the correlation would be higher than .7833; it'd be near .9898 or so.

So what is missing from the generic soccer statistical community to account for the void in Unsuccessful Passes?

Is it another statistic like Tackles Won, Duals Won, Blocked Shots or Recoveries?

I don't think so - none of them generated a marked increase in the overall correlation of those three Activities already identified.

I think it is the physical and spatial pressure applied by the defenders as they work man to man and zone defending efforts.

In Closing...

To date I'm not aware of any statistics that log 'pressure applied' to the attacking team.  A good way to count that would be tracking how many seconds the defending team gives an opponent when they recieve the ball and take action.

My expectation is that the less time, given the opponent, the more likely they will hurry a pass that simply goes awry without any other statistic event to account for that other than - bad pass due to being hurried.

So in other words; like the NFL tracks hurried passes, I think that the Soccer statistical community should also track "hurried passes"...

I'm not sure that completely closes the gap between those three Defensive Activities and Unsuccessful Passes but it does seem to be a relevant statistic that can attempt to quantify panic in an attacker while also quantifying good physical and spatial pressure by a defender.  Two relevant items of interest to a coach in weighing the balance on who plays and who doesn't and who they might like to add to their team or perhaps put on loan/trade elsewhere.

The Official statistic that would get tracked for attacking players is 'Hurried Passes' and the statistic that would get tracked for defensive players is 'Passes Hurried'.

In addition - an increase in hurried passes can become a training topic that drives a Head Coach to develop tailor made passing or turning drills to minimize Hurried Passes (make space) while also providing a Head Coach statistical information to generate tailor made defensive drills that look to increase Passes Hurried.  I'd expect the level of the training drills to vary given the level of skill/professional development as well.

So how might someone define a "Hurried Pass"?  I'm not sure; there are plenty of smarter people out there in the soccer community than me - if I had to offer up a few suggestions it might be a pass that goes out of bounds given defensive pressure, or maybe a through-ball that goes amiss given pressure from a defender - in other words the timing of the delivery looked bad and given defensive pressure it was off-target.

However defined if judgment can be applied when identifying a pass as a key pass then it stands to reason that judgment can be applied to identify a bad pass as being bad because the defender hurried the attacker.

More to follow...

Best, Chris


Should away teams be more aggressive?

Second Half Shot chart - HOUvPOR - April 2014

The Portland Timbers traveled to Houston on Sunday in desperate need of three points to get out of the cellar in the Western Conference. They played well in the first half, outshooting the Dynamo 8 – 7 en route to a 1 – 1 tie, while dominating possession. Then Portland came out in the second half much like many away teams do with a tie score, conservatively. The second-half shot charts to the right serve as an indication of the change in strategy.  

This conjured up a question that constantly bugs me. Should away teams go for wins more often when tied in the second half? Let's get right to the data. Here is chart summarizing the offensive aggression of away teams during gamestates when the score is tied and the teams are playing with the same number of players. The data presents the proportion of totals earned by the away team in both the first and second halves.

2013-14 Goals xGoals Shots
1st Half 44.8% (266) 42.3% (282.9) 43.4% (2948)
2nd Half 34.8% (184) 37.4% (168.6) 39.7% (1654)
P-value 0.017 --- 0.007

The away team consistently garners 42% to 45% of these primary offensive stats during the first half, and then drops down to the 35%-to-40% range in the second half. For the proportions of goals and shots, those differences are statistically significant (there is no simple test for xGoals%, but it is probably statistically significant as well).

My instinct is that away teams are capable of playing in the second half as they do in the first half, and that these discrepancies are a product of conscious decision making by away coaches and players. Teams likely change strategy in the second half to preserve a tie. Playing more openly would ostensibly increase the chances of both a loss and win, while decreasing the chances of a tie. However, I would think based on the data above that it would increase the chances of a win more so than the chances of a loss. Since a win would earn the away team an extra two points, while a loss would cost it just one, my gut says teams should go for it more often.

Are away teams playing conservatively because mindless soccer conventionality tells them that it's okay to get one point on the road? Is this the self-detrimental risk aversion that plagues coaches in other sports, or are these numbers missing something that could justify the conservative play?

I can't say that I've proven anything, but these data suggest the former.

PWP - Who's Best and Worst after 8 Weeks

Another exciting week in Major League Soccer. Most of the headlines belong to New York, Seattle, DC United and New England as those four teams along with San Jose took 3 points; the instant measurement of success.

Duly noted, but a growing indicator in popularity is Possession with Purpose and the composite difference between how well an MLS team attacks versus defends across the broad spectrum of six key performance indicators in attack.  It's grown enough that after answering my question about Passing Accuracy last Thursday Caleb Porter looked to me, smiled,  and said "Possession with Purpose".

If you're not familiar with those Six Steps here they are in a nutshell:

  1. Possession,
  2. Passing Accuracy across the entire pitch,
  3. Penetration (that percentage of passing a team successfully accomplishes within the Final Third),
  4. Creation of Goal Scoring Opportunities (that percentage of shots taken relative to successful passing within the Final Third),
  5. Putting those shots on goal, and
  6. Goals scored

In case you missed it the relationship of the data points supporting PWP Analysis (after 102 games this year) is very strong regardless of winning, losing or drawing; with the Correlation for Winning being; .9898, drawing; .9827 and losing; .9564.  Click Expected Wins (XpW) to read more...

And if not convinced that this effort is taking hold elsewhere it appears Ted Knutson (@statsbomb) has taken up the gauntlet to see how opponents passing behaviors impact defensive activities in the European Leagues; you may find this article of interest as well.

It will be interesting to see what insights Ted can offer on this; especially given he's got three additional leagues to evaluate.  A great example coming up this week for MLS is the match between DC United and Portland.

DC United average over 18 crosses a game (home and away) playing a Diamond formation (6 of 7 games) - will that pattern continue against Portland or do we see a different defensive approach by Portland to manage (and reduce) that volume of crosses and thereby try to mitigate the strength of Eddie Johnson in the air???  (As noted on occasion by Sir Arthur Conan Doyle --- "The game is afoot" replied Holmes to his loyal companion, Watson.)

With that offered here's how the 19 teams in MLS compare to each other after eight weeks following the PWP guidelines:

PWP Composite Index Through Week 8

The tale of the tape sees Seattle clear the first quarter-mile hurdle ahead of Sporting KC and Colorado.  A strong indication that they are serious contenders for the Shield - and yes you would think so given their position in the Standings and that comprehensive victory against Colorado.

But waiting in the shadows, with three games in hand, is a very potent team called LA Galaxy; nine points from those three games in hand puts them atop the West.  And of note is that LA currently have the best PWP Composite Index of any team in MLS.

Can you hold your breath until July 26th when these two teams meet for the first time on National TV?  And how about the last two games of the regular season - back to back Nationally televised games again... wow......

Talk about a story-line; and all that coming after the World Cup...

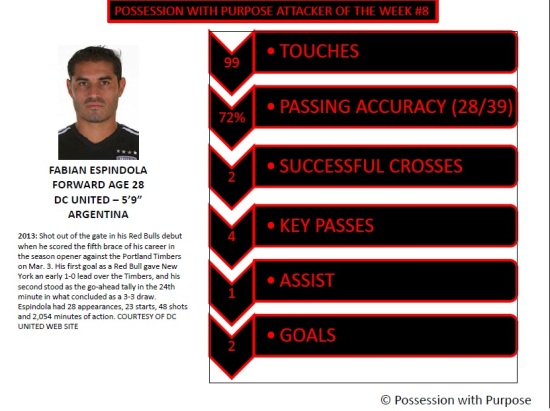
But back to the basics; DC United took great advantage of Zach Loyd and his 2nd Yellow (Red Card) in the 39'th minute; scoring four goals and icing the game with Fabian Espindola's second from an assist by Chris Rofle.

While I didn't see the game I did get to watch the MLSSoccer.com recap here...  seems a bit dubious that two yellows like that would garner a Red Card but on the first one Loyd was clearly out of position and his pulling back Espindola warranted a Yellow given how tight the Referee's have called games this year.

As for the second - well - any time you go studs up into a tackle you deserve a Yellow; shame on Loyd for two Yellows... and like Collin (Sporting KC) he put his team at a distinct disadvantage...

Other teams making moves this week included San Jose beating a woeful Chivas while Houston dropped two points by drawing, at home, to Portland. 

What was interesting to me about that game was how pedestrian, at times, the possession for Portland was.  Clearly there is an attempt by Caleb Porter to resurrect the successful possession based approach leveraged last year.

If a player like Gaston Fernandez can pair up more readily with the likes of Valeri and Nagbe then the Rose City should begin to feel better.  A great test comes this next weekend as they entertain another possession based team, DC United.

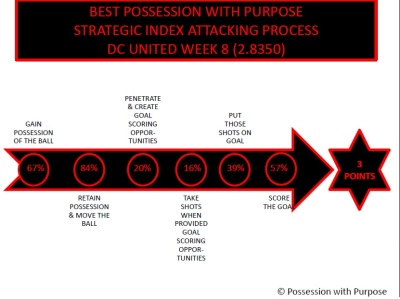
PWP Attacking Team of the week:  DC United


PWP Attacking Team of Week 8

DC United had a superb 84% completion rating in Passing; much no doubt do to Loyd being sent off before the first half.  But hey, if you can't dominate a team when they are a man down then you're not a good team... DC United proved they were good this weekend and proved it in style.

As for Seattle; sadly they had to play against an 11 man Colorado.  If not it is likely they would have scored 6 or 7 goals against the Rapids...

Mastroeni will need to work his back-four hard as they prepare for LA this weekend.

PWP Attacking Player of Week 8: Fabian Espindola

PWP Attacking Player of Week 8

Pretty comprehensive as Espindola took great advantage, as did his teammates, with Loyd's poor performance...

Another player getting big headlines this weekend was Clint Dempsey.  Here's how Clint lined up playing against the full strength Rapids:  99 touches, 55/59 (93% passing accuracy), 2 Key Passes and 2 Goals.  So a great game for Dempsey and a solid indication that his run of play over the last 3-4 games has been superb...

Other notable team attacking performances this week saw New York completely blast Houston 4-nil; that is two games running where New York matched or exceeded their PWP Index rating for last year - is it any wonder they've won the last two games?

As for bottom dwellers, Philadelphia was the only team in the bottom four without a Red Card; worst of the bunch this past week also included Chivas, Sporting KC, and FC Dallas.

Maybe it's just me but another reason why a team's Index shouldn't double count the impact of a Red or Yellow Card - when players get booked (regardless of red or yellow) does it impact overall team PWP performance?  I think so, and I'll look into that at the half-way point of the season.

I'll look at teams that lose with and without players that got booked; not sure what I'll find out but it should be interesting to see if it can be quantified to some extent.

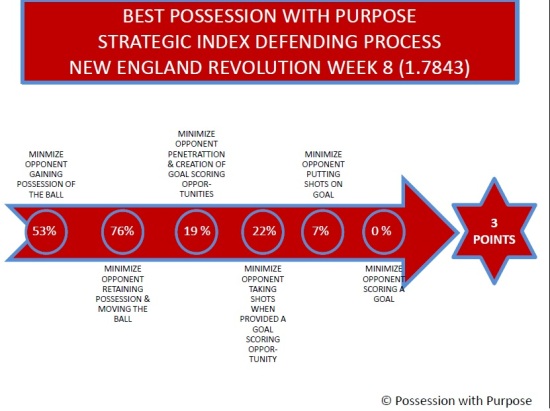
PWP Defending Team of Week #8:  New England Revolution

PWP Defending Team of Week 8

A clean sheet is a clean sheet and so on... shutting out Sporting is probably easier at home than on the road - the rematches will be big games and Collin is probably pretty narked for that Red Card.  We shouldn't be surprised though; he's traditionally untimely in his tackles and with Opara (still injured?) Vermes may be hard pressed to find a suitable replacement.

Anyhow - the top play here was the back-four for New England shutting down Dwyer and Zusi... well done and not a surprise...

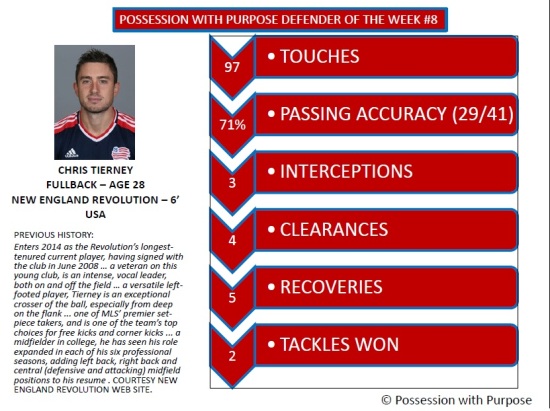
PWP Defending Player of Week 8: Chris Tierney


PWP Defending Player of Week 8

The toughest pick I had this week was selecting which defender got the award; both AJ Soares and Chris Tierney stood out over the others.

AJ offered up these defending attributes... 30 of 38 in passing for 79% accuracy, 69 touches, 1 tackle won, 2 blacked shots, 2 interceptions, 6 clearances and 3 recoveries.  Pretty close to the same outputs by Tierney - more appropriate though was the fact that the two of them partnered on the Revolution defensive left side, in their own final third in stopping 12 of 38 passes by Sporting KC.

In my view Tierney and Soares were far more productive for their team this weekend than Farrell - this isn't the first time my PWP Players or teams don't match what comes out of MLSSoccer.com - different views offer different outputs... both have value.

Congrats to San Jose for their clean sheet and kudo's for Montreal winning a game that a switched-on Union should have won hands down... wow - what a surprise that outcome was!

Stay tuned for my PWP-Pick-List Week 9;  I'm at 44% success rate and I took a clean hit across the cheek when Montreal and New England took three points while Real Salt Lake gave away two points in that complete melt down against Vancouver.... my, oh my, oh my...

Best, Chris


Individual Defensive Statistics: Which Ones Matter and Top 10 MLS Defenders

When a car breaks down, a mechanic's job is to tell you what caused the failure. He or she can generally pinpoint the problem to a specific part reaching the end of its useful life. But have you ever asked a mechanic why your car is working fine? Or which part deserves the most credit for your car running smoothly? Of course not. That would be a waste of everyone's time. There are many parts to a car and all are doing their job as designed. We never ask why when things are going well. The same dilemma exists in assessing soccer defenders. After all, most of how we assess defenders has to do with what goals were not scored. And when all the parts of the defenses are working as designed, goals are avoided. But which defenders deserve the credit when goals aren't scored? It's like the pointless car question, which parts of the car deserve the most credit when the car runs smoothly?

To even begin this conversation we need to take stock of what data exists for soccer defenders. And just to be clear, I am going to steer clear looking at a defender's offensive capability. I want to focus solely on defensive statistics. Whoscored is the only site that offers a collection of defensive statistics, and here is what they have and their definitions.

  • Blocked Shot: Prevention by an outfield player of an opponents shot reaching the goal
  • Clearance: Action by a defending player that temporarily removes the attacking threat on their goal/that effectively alleviates pressure on their goal
  • Interception: Preventing an opponent's pass from reaching their teammates
  • Offside Won: The last man to step up to catch an opponent in an offside position
  • Tackle: Dispossessing an opponent, whether the tackling player comes away with the ball or not

These are the defensive-oriented statistics offered by Whoscored that are tracked at the individual player level. Of course, the other vital defensive statistic is shots conceded but those can't be attributed to any one player. So then, do any of these statistics matter? First there are a couple of assumptions to iron out.

A defender should be judged by the rate at which he accumulates statistics. So to get to that number we need to adjust these statistics to account for the time that the opponent has the ball. For example, Player A who averages 5 clearances per game might be better than Player B who averages 6 clearances if Player A's opposition had the ball 20% less often. That would mean player A made more clearances given the opportunities provided to him. So I will adjust all metrics by opposition possession.

Since I am trying to assess what goals are not scored, I going to look at the numbers at the team level first. It is only at the team level that goals can be attributed. After that analysis I will attempt to attribute value to the individual metrics.

sources: whoscored, mlssoccer.com

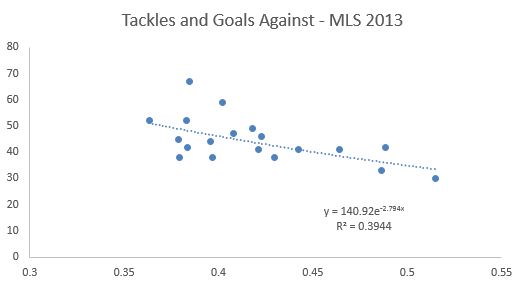
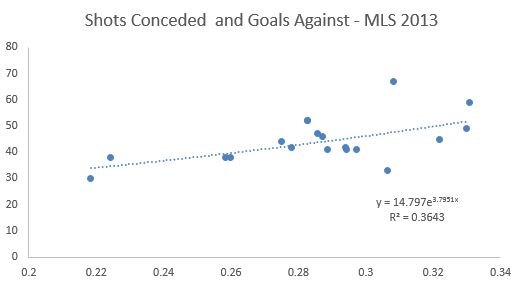
Here are tackles per game per minute of opponent possession against goals scored. Tackles represents the strongest correlation of all the variables. In fact, tackles has a slightly stronger correlation to goals against than shots conceded. Here is a look at the shots conceded as a percent of opponent minute of possession.

sources: whoscored.com, mlssoccer.com

The two points to the far left represent the LA Galaxy and Sporting Kansas City. They appear adept at limiting shots on goal per minute of opposition possession. They also stand out when looking at offsides won.

Rather than show every graph, here is a table of the defensive statistics, their level of impact and the R squared of the impact in predicting goals against.

Statistic

Goals Avoided per Unit

R squared

Clearances

-0.041

27.1%

Interceptions

-0.036

15.1%

Tackles

-0.077

39.4%

Offsides Won

-0.113

16.0%

Blocks % of Shots

-0.017

0.3%

Offsides won is the most impactful of the statistics (has the greatest slope) but there is a weaker correlation than Tackles or Clearances--in other words, there are greater deviations from the trend line. It's interesting to see that Blocks as a percent of shots has almost no impact on goals allowed.

This is interesting, but what to make of it all? In an ideal world we could compile these statistics into a meaningful metric in order to compare players. The most obvious way to do that statistically would be to run a multivariate regression using all of the statistics.  The trouble with the result is that the statistics end up not being statistically significant predictors when mashed together. So developing a score from these metrics would be a bit of a fool's errand.

The other option would be to ignore the predictive strength of the variables and just use the goals avoided results as a scalar, multiply them by each player's statistics, add them up and compile a score. In this case the resulting score would be something we relate to as we could say that this player avoids x number of goals per game. However, this would give offsides won the statistic with the greatest importance despite the fact that the correlation is not strong.

To factor in the correlation we could leave the realm of sound statistical practice. We could multiply the goals avoided scalar by the R square. We could turn that into an index with the highest metric (tackles) equaling 1. If we did that here is the resulting table and values for each metric.

Statistic

Goals Avoided per Unit

R squared

GApU x R2

Index

Clearances

-0.041

27.1%

-0.011

0.37

Interceptions

-0.036

15.1%

-0.005

0.18

Tackles

-0.077

39.4%

-0.030

1.00

Offsides Won

-0.113

16.0%

-0.018

0.60

Blocks % of Shots

-0.017

0.3%

0.000

0.00

Tackles would be the most important statistic followed by offsides won and then clearances and interceptions. It turns out blocked shots have no material value in estimating goals against.

Before I use these numbers to reveal the top 10 MLS defenders, here are the caveats. Obviously this ranking is missing a few vital elements of defending in soccer. The first major omission is positioning. Often a defender being in the right position forces an offense to not make a pass that would increase their chance of scoring. There is no measurement for that but obviously a defender out of position is not a valuable defender. Clearances, interceptions, tackles and offsides won are clearing indicators that the player was probably in position to make the play and they indicate the player succeeding making the necessary play. But offensive attempts avoided are clearly missing.

The other major omission is the offensive play of the defender. A defender who defends well and represents an offensive threat is that much more valuable. But I'm not trying to solve for that here. I leave that for the subject of another post to integrate passing and offensive numbers to build a better score for defenders.

Here are the top 10 MLS defenders based on the score developed through the last week for players with a minimum of four appearances.

Rank

Name

Team

Tackles

Intercepts

Off Won

Clears

Defender Score

1

José Gonçalves

New England Rev.

1.6

2.4

2

11.2

7.376

2

Giancarlo Gonzalez

Columbus Crew

2.1

2.9

1.9

9.3

7.203

3

Norberto Paparatto

Portland Timbers

1.8

4.8

1.3

9.3

6.885

4

Carlos Bocanegra

CD Chivas USA

1.5

3.6

2.1

8.9

6.701

5

Andrew Farrell

New England Rev.

2.9

2.4

0.3

8.3

6.583

6

Jamison Olave

New York Red Bulls

1.9

3.1

1.7

6.7

5.957

7

Victor Bernardez

San Jose Quakes

1.5

2.8

0.7

9.5

5.939

8

Matt Hedges

FC Dallas

1.5

3.9

0.9

8.5

5.887

9

Eric Avila

CD Chivas USA

4

2.4

0.8

2.3

5.763

10

Chris Schuler

Real Salt Lake

1.8

2.8

0.5

8.3

5.675

I find it comforting that, for a new metric, Jose' Goncalves, MLS Defender of the Year in 2013, tops the list. There's a big drop between the top 2 defenders and Paparatto. There's also another cliff after Andrew Farrell. But hey, it's a start.

I hope this was an enlightening ride through the mechanics of defending from a soccer perspective. The next time you're watching a game, don't just focus on the breakdowns. Also look for what makes the defense successful.

Cumulative PWP: Four-Horse race to the Shield?

Early indications show it may be at least a four-horse race (at the near quarter-mile post) with FC Dallas, Columbus, Sporting, and LA leading the way. Other favorites as Week 8 begins should include Colorado, Seattle, Real Salt Lake, and maybe a real sleeper (statistics wise) Toronto.

Note any early-season favorites missing? The obvious here are the two incumbent conference champions, New York and Portland. Defensive woes highlight their early season takeaways.

New York's stategy last year (get more goals than the opponent) has only worked once this year and Portland's strategy, patience and accuracy in their possession with purpose has taken a back seat to the poorly performing back-four. And in this case, even though four goals against come from Penalty Kicks (set-pieces) what that really means is the back-four (and some defending midfielders - Zemanski in particular) have not done their job.

If PWP is new to you here's a link to the Introduction and some explanations - another link that may be useful is my new Expected Wins (XpW) article getting down to the basics - winning and the tendencies of teams that win.

Given the early stages of this horse race, here's my traditional diagram for consideration:

PWP Composite Index Through Week 7

Prime movers this week include LA Galaxy dropping three places with that draw to Vancouver and two goals scored per each team.

Others taking a hit to their Index rating were DC United dropping two places with their hard fought draw against Columbus; Portland with that gut wrenching loss (superb saves by Rimando) away to Real Salt Lake and Montreal - a continued drop of two places after getting spanked by Sporting.

Bottom dwellers continue with San Jose and Chivas moving nowhere - while some might feel keeping Chivas (with a new name) in LA is a good thing I'd offer that moving them out may REALLY help kill the stigma of them simply not being a team that will compete regularly for a Playoff position.

Maybe St. Louis or some other city is better placed to host that organization?

Anyhow, FC Dallas, Columbus (almost by default) and Sporting KC all moved up a notch at the expense of LA while RSL continued their move up the Index as they leapfrogged Vancouver, DC United and Philadelphia.

Bottom line in this is that some teams continue to jockey for overall position but the moves up and down were less dramatic, as a whole, this week, than in previous weeks.  Solid play breeds confidence and confidence breeds success.

In looking at the Attacking side of the equation here's the teams from top to bottom:

PWP Composite Attacking Index Through Week 7

Can anybody really question Pareja's approach in Dallas so far this year?  Probably not - a Toronto side came to town with their brand of away football and came away with nil-pwa.

Of the eight top attacking teams seven of them exceed 50% in possession percentage with Real Salt Lake (49.77%) being the lone wolf; go figure that one?!?  That being said four of their first seven have been away games and three of those four away games saw them at ~49%, 43%, and 45%.

So back to some general indicators on the attacking side - all four of the top teams in attack exceed 40% in goals scored from shots on goal - yet none of those teams is in the top four for Shots on Goal versus Shots Taken; those four teams are Montreal, Real Salt Lake, Vancouver and Sporting.  A trend more noticable in my Expected Wins article...

Teams making the most effective use of penetration into the Atacking Third are New England (~29%), Houston (~24%), Philadelphia (~23%), and Columbus at (~23%).  Bottom dwellers in percentage of total passes inside the Attacking Third are Montreal (~17%), Colorado (~17%) with Sporting and FC Dallas at (~18%).

A good indicator for Portland (based upon last year's averages) is that 18.83% of their possession has been in the Final Third.  What has lacked is controlling individual mistakes and positional play in Defense.

Will Johnson had some frustrated words to offer after that loss in Real Salt Lake (that I won't quote) - hey - give the guy a break - he's a fierce competitor and like most any of these guys he simply hates to lose...  but he's right; professionals get paid to put up their best in tight situations.

If training doesn't help some get better than it's time for personnel changes...

Moving onto Defense and the PWP Composite Defending Index:

PWP Composite Defending Index Through Week 7

Like last year Sporting KC is simply tough in defense; and after 7 weeks of play they have now found themselves leading the pack... about time I expect...

Other top performing defending teams include LA, Colorado, Columbus and New England.  A continued presence by DC United should give warning that Olsen seems to be doing better in stopping their goals-against rot from last year.  Is it Boswell who's made the overall difference?

In looking at the tail end both Chivas and Montreal continue to wallow at the back of the pack while Chicago, under Yallop, can't seem to gallop at full stride yet either.

A few other notables here; FC Dallas, Seattle and Real Salt Lake are in the bottom ten on the defensive side of the pitch - that strategy was an indicator of New York simply outscoring their opponents.

A run of bad luck, shoddy shoes, dodgy goal keeping, or getting hamstrung with injuries could have a huge impact in their overall outputs.

The teams that should scare people the most are Sporting and LA Galaxy... and with Colorado and Columbus looking to gain confidence (and chemistry in their attack) they too may put paid to rest this idea that a team can simply win more games by outscoring their opponent.

That approach got New York the Supporter's Shield last year but not the Championship - I think the teams going for it this year want the Championship and/or first place in their respective Divisions'.

In closing...

The plot thickens as does the muck and the mud on the track at the first turn in this yearly Derby. Hurdles await as does time spent at the World Cup, where the stakes for some players are so much higher than others.

Looking forward to an exciting weekend of MLS, and really wish the DC United match against FC Dallas was televised on National TV!

Best, Chris


MLS Week 8: Top 50 Shots

Okay, shots. We talk a lot about shots because, well, shots lead to goals. Obviously you can't have a goal without first attempting a shot. I know that was a deep thought, but just go with me here. We put a lot of emphasis on shots here and have dug into their expectation leading to goals. It's backed by the belief that shots are important statistics in correlation to team success. Now there are plenty of caveats to shots and we use them to influence our ideas of what is good or bad. Matthias has taken time to explain at least some of them.

So with all that said you can't read too much into all of these numbers. Take for instance the fact that Frederico Higuian creates 7.03 shots per 90 minutes. That's nearly a shot and a quarter more than Brad Davis at 5.79. Is Higuian a better shot creator because he creates one additional shot over the course of a single match? If that shot is from zone 4 or even 5, the value of that single shot becomes marginalized in that specific instance.

Despite all of those various acknowledgements of how this is marginally interesting, and yet mostly a useless exercise, I put together a follow-up of last week's top 50 individual shots creators in Major League Soccer. I decided it was best to cut up this data and present it via a tiered system to make it a bit more palatable and to highlight the players that have set themselves apart from their peers. Also, this allows me to be a bit creative in the tier process.

IBC Root Beer Tier - "The Best of the Best."

Player Club POS MINS G A SHTS Key Passes Sh-C Sh-C p90
1 Marco Di Vaio MTL F 326 1 1 24 4 29 8.01
2 Clint Dempsey SEA M 393 6 3 23 7 33 7.56
3 Federico Higuain CLB F 538 4 2 20 20 42 7.03
4 Robbie Keane LA F 450 4 1 22 12 35 7.00
5 Pedro Morales VAN M 472 1 2 19 15 36 6.86
6 Thierry Henry NY F 449 2 0 23 9 32 6.41

Oh, yeah... Marco Di Viao. He's also pretty good at this whole soccer thing. I guess we can all say that we could have guessed every singl--what the hell is Pedro Morales doing in there??? I guess that probably explains a lot about what's been happening in Vancouver. He's second overall in total Shots Created and he could very well be a shoo-in for MLS Newcomer of the Year.  He's like the offensive equivalent of what Jose Goncalves was last year to New England. I only have one question: who is this Camilo guy everyone was talking about?

Stewart's Root Beer Tier - "You don't have IBC? Who doesn't have IBC?"

Player Club POS MINS G A SHTS Key Passes Sh-C Sh-C p90
7 Landon Donovan LA M-F 450 0 2 13 14 29 5.80
8 Brad Davis HOU M 311 0 2 3 15 20 5.79
9 Graham Zusi KC F-M 450 1 3 9 16 28 5.60
10 Diego Valeri POR M 579 1 0 19 16 35 5.44
11 Dom Dwyer KC F 427 4 0 22 3 25 5.27
12 Leo Fernandes PHI F 436 2 1 13 11 25 5.16
13 Lloyd Sam NY M 621 1 3 12 20 35 5.07
14 Mike Magee CHI F 450 1 2 15 8 25 5.00
15 Giles Barnes HOU M 527 0 1 22 6 29 4.95
16 Justin Mapp MTL M 585 0 3 11 18 32 4.92
17 Michael Bradley TOR M 433 1 0 6 17 23 4.78
18 Mauro Diaz DAL M 604 2 3 13 16 32 4.77
19 Quincy Amarikwa CHI F 548 4 1 16 12 29 4.76
20 Felipe Martins MTL M 626 1 2 18 13 33 4.74
21 Gilberto TOR F 423 0 0 13 9 22 4.68
22 Cristian Maidana PHI M 425 0 2 11 9 22 4.66
23 Deshorn Brown COL F 448 1 0 19 4 23 4.62
24 Chris Wondolowski SJ F-M 450 3 0 20 3 23 4.60
25 Fabian Espindola DC F 531 2 2 11 14 27 4.58
26 Michel DAL M-D 401 3 2 11 7 20 4.49
27 Lamar Neagle SEA F 506 2 2 16 6 24 4.27
28 Obafemi Martins SEA F 620 2 4 13 12 29 4.21
29 Erick Torres CHV F 603 6 0 22 6 28 4.18
30 Javier Morales RSL M 527 0 2 7 15 24 4.10

Justin Mapp has the same amount of total Shots Created as Mauro Diaz in almost 20 minutes less field time. Try thinking about that next time you're frustrated by Mapp's hair line. Try.

Dom Dwyer does not go away. This guy could be someone that we may need to start legitimately talking about in the coming weeks. You should probably add Leo Fernandez and Lloyd Sam to that obnoxious hype list too.

Speaking of Sam, I added him to my MLS Fantasy Roster for tonight, hedging the bet that he finally scores a goal. At last look, the guy currently holds the highest xGoal predictor score without actually scoring a goal. If there was ever a guy that was "due" to score a goal, it's him and I'm virtually betting on it happening.

On the note of not scoring goals, "Hi, Landon Donovan". Who, in case you didn't notice, is still a good player even when not putting the ball in the back of the net. Because, you know, skillz.


Barqs Root Beer Tier - "Old Reliable"

Player Club POS MINS G A SHTS Key Passes Sh-C Sh-C p90
31 Dwayne De Rosario TOR M 254 0 0 10 1 11 3.90
32 Mauro Rosales CHV M 626 0 3 10 14 27 3.88
33 Kenny Miller VAN F 537 3 1 14 8 23 3.85
34 Bradley Wright-Phillips NY F 358 1 0 12 3 15 3.77
35 Darren Mattocks VAN F 580 2 3 13 8 24 3.72
36 Jack McInerney MTL F 436 2 1 13 4 18 3.72
37 Will Bruin HOU F 539 3 1 14 7 22 3.67
38 Baggio Husidic LA M 344 1 1 7 6 14 3.66
39 Bernardo Anor CLB M 497 2 0 16 4 20 3.62
40 Hector Jimenez CLB M 523 1 2 9 10 21 3.61
41 Teal Bunbury NE F 630 0 1 14 10 25 3.57
42 Diego Fagundez NE M-F 584 0 0 19 4 23 3.54
43 Sal Zizzo KC F 433 0 2 10 5 17 3.53
44 Kenny Cooper SEA F 358 2 1 12 1 14 3.52
45 Benny Feilhaber KC M 539 1 1 8 12 21 3.51
46 Juninho LA M 448 0 2 8 7 17 3.42
47 Andrew Wenger PHI F 528 2 0 14 6 20 3.41
48 Eric Alexander NY M 451 0 3 7 7 17 3.39
49 Alex CHI M 512 0 0 12 7 19 3.34
50 Saer Sene NE M 355 0 0 8 5 13 3.30


There are roughly 19 names here and I'm not going to go through them all. But key surprises are Jack McInerney, who everyone continues to think is "slumping" when he's not scoring goals. Baggio Husidic is making waves in that flashy new diamond attack in LA. Husidic is filling the hole that once upon a time existed out wide and makes the Robbie Rogers-trade look worse and worse, as he likely won't make it past a bench position upon return. Bernardo Anor has been doing a lot for Columbus out of the midfield but, perhaps, the bigger story than Anor--or even the LA trade for Rogers--is that fact that Gregg Berhalter pretty much stole Hector Jimenez who is looking brilliant in his new Crew colors.

Lastly, three other off season moves are having impacts with their new clubs.

  1. Teal Bunbury is finally being "the other guy" and taking shots in New England. Lord knows they need to start converting those opportunities.
  2. Sal Zizzo wasn't exactly a headline move this off-season, but since being let go by Portland this past off-season he's been a gold staple in the Sporting KC line-up.
  3. Kenny Cooper is having himself a quietly productive first season in the Emerald City. Yes, it's towards the bottom of the line-up and it doesn't really mean much of anything. But he's been reliable and fits in with Clint Dempsey and Oba Martins, playing the third/fourth fiddle and doing whatever needs to happen. Great role for him and he's doing it well.

There are a lot of things to take away from this. Like why didn't I just make two tiers: IBC Rootbeer and Barqs, which is basically all you're going to go with unless there is some local brewed Root beer that you want to try for funsies. Anyways, some information here. Not necessarily good information, but at this stage of analysis and data when it comes to MLS, and really soccer in general, what is "good" information?

PWP Week 7: Zusi has a Sporting impact as Moor Rapidly manages threat of Earthquakes

Week 7 got an early start with a first for New York this year - a win. Was there anything else that stood out this week, and who managed the top spot? To kick off my PWP for Week 7, and only week 7, here's my traditional diagram showing the highs and lows and everyone in between..

The Capt. Obvious here is the 4-nil thrashing that Sporting KC put on Montreal; if there is a Head Coach on the hot seat, in the early days of 2014, it's likely to be Frank Klopas; wow...

What may be surprising to you is that Dom Dwyer did not get my PWP Attacking Player of the Week; why?

Because most good strikers score goals - what's critical in my view is the amount of set-up and overall interaction that goes with creating those goal scoring opportunities.  And as much as I'd like to favor Dom Dwyer, he had just 58 touches with 11 passes, 5 of them unsuccessful for a 54% passing accuracy...  good but not great in my view.

Other teams getting worthy results this week were Seattle, Real, and Dallas in addition to New York, hopeful of taking three points but somewhat satisfied with one point are New England, San Jose and DC United; disappointed with draws were most probably Chicago, Colorado and Columbus.

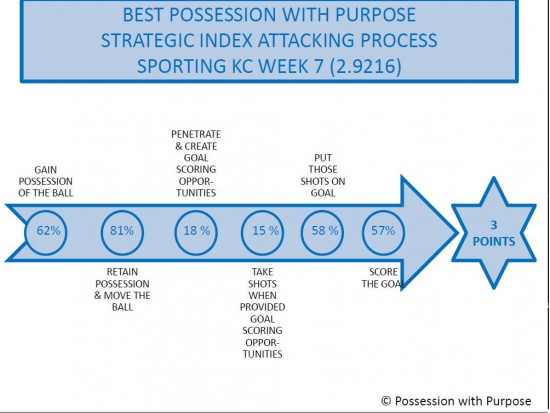
In considering Sporting KC scored three, plus got an own-goal by Montreal, how did their Six Steps in the PWP Process play out?  Below are the overall outputs:

PWP Attacking Process Sporting KC Week 7

In case you missed it one of my newer focus areas this year is passing accuracy.

For now I think there is great value in recognizing how much influence 81% passing accuracy has across the entire pitch; even more so within the Final Third.

For this game Sporting were successful in completing ~71% of their passes in the Final third; that accuracy led to having 58% of their shots taken go on goal and a 57% success rating in having those shots on goal score goals.

In simple terms it almost didn't matter where the shots were taken that scored (2 outside the 6 yard box and 1 outside the 18 yard box) - plus an own goal (from between the corner of the 6 and 18 yard box).

To get a better picture on that relationship between passing, penetration and goal scoring you may want to read this latest on Expected Wins.

For now here's my PWP Attacking Player of Week 7:  Graham Zusi.

Some pretty comprehensive play by Graham Zusi.  His volume of touches, passing accuracy, and work within the midfield (in defense) as well as his accuracy (final third) was crucial in creating scoring opportunities for Sporting.  What speaks more to me about Graham is his continued growth in playing on both sides of the ball.  That rigor and discipline will do well to help him and his teammates in the World Cup this year.

Of note is that Graham offered up five successful crosses; that's more than the per game average for all these teams in MLS this year: Colorado, Chivas, DC United, FC Dallas, New England, Portland, Philadelphia, Real and Vancouver.

By the way, the most successful team in delivering crosses this year is LA; with a 34.06% success rate.

Toronto is next at 32.21% while Sporting is 3rd best at 31.69%.  Bottom of the league in offering up successful crosses per game is Portland at just 16.34%.

Moving on to the Defending PWP team of Week 7:

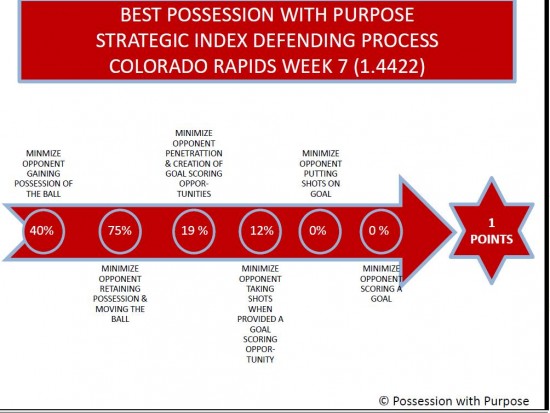
PWP Defending Process Colorado Week 7

This one may have come as a surprise but in looking at the attack of San Jose it's no wonder Colorado looks this good when defending against them.

All told San Jose had no shots on goal and no goals scored with minimal penetration generating just 6 shots, 2 of which were blocked.

Bottom line is that Colorado basically snuffed out just about everything San Jose had to offer.

So who is my PWP Defending Player of the Week?

All told O'Neill, Piermayr and Klute all had great games with O'Neill completing 49 of 52 passes playing right fullback.  Hard choice this game by my award goes to Drew Moor.

In a league where top flight Center-Backs are needed, Moor did a great job controlling the 18 yard box against a team that loves to cross the ball.

San Jose completed just 5 of 23 crosses - and for a guy like Wondolowski, who lives of crosses, Moor did a stand-up job.

Here's the highlighted statistics I picked out for him this game.

In Closing...

Week 7 has come and gone and the chase continues; some look to be dropping back a bit further while others rise to the top on a regular basis.

Next up I'll get into the Composite Index for all games played to date.

For now know that it's getting pretty packed up top - but clarity on the five playoff spots for each conference will take a while to sort itself out, as it should.

Best, Chris

How it Happened: Week seven

I hate to be a disappointment, but Easter weekend means I only got to review two matches instead of the usual three. One was a doozy: a premier matchup of Western Conference powers, while the other had a pretty incredible final five minutes. On to the show (and if you're really jonesing for some analysis of Chivas-Seattle from Saturday night, I'll probably tweet some thoughts when I catch up on it later this week).

Real Salt Lake 1 - 0 Portland Timbers

Stat that told the story for Salt Lake: 23/37 passes in attacking center of the field

Stat that told the story for Portland: 7/12 passes in attacking center of the field

rslpor7


We're breaking new ground with this one: I'm combining both teams' stats for this game. These two teams have had drastically different starts to the season, with RSL grinding out results against a very difficult schedule and Portland failing to do the same against an easier slate. Still, the margin of quality between these teams is pretty slim, and that fact was borne out this weekend.

From a Real Salt Lake standpoint, this game was pretty much par for the course for 2014 and really the last five seasons. Aside from a few surprising miscues in possession that gifted chances to the Timbers, RSL's diamond midfield was good in possession and solid in defense. They found a weakness in Portland's defense by attacking the channel to the right of the Timbers' centerbacks (that's where all the incisive passes above, and Ned Grabavoy's goal, came). Even though they weren't at their clinical best, using tiki-taka passes to break through the backline, RSL did their job and got three points at home.

As a Timbers fan, it's yet another missed opportunity for Portland to get that elusive first win of the year. Theories of what's plaguing the 2014 Timbers are abound, and like ghost stories or craft beers, I have my likes and dislikes. I'll say two things on PTFC here: (1) their demise is overstated. Portland has hit the post like a million times already this year,* and the Timbers have only been outscored by four goals (coincidentally the number of penalties they've given up). Once those two areas regress to the mean, it's likely the Timbers will start to earn points and earn them fast.

*Portland leads the league in posts and crossbars hit during even gamestates with four.

But that brings me to (2): the Timbers aren't playing as well as they did for much of last season. They are a team that thrives on possession when at their best, yet they've been out-possessed in each of their last five games. It's like Portland is always flooring the engine, pushing the ball vertical to rush into shots instead of occasionally using cruise control and slowing the game down. A huge issue for them in this game was their lack of penetration in attack, as illustrated by the image above. Still, the game went back and forth with Portland and RSL both controlling the game for portions, and only the quality finish by Grabavoy instead of the fluffed chances by Maxi Urruti decided the result.

Chicago Fire 1 - 1 New England Revolution

Stat that told the story for New England: Teal Bunbury playing out of position in his position

ne7

That stat above makes no sense, so I'll let someone much wiser than me explain.

shinguardian

Bunbury has been playing up top for New England for the entirety of this season, and while he's always been thought of as a striker, he fits better as a winger in the Revolution's system. His speed is his greatest asset while his finishing leaves something to be desired, two sure signs that lone striker isn't necessarily your best fit. At center forward in this one, Bunbury gave a lot of great effort and the team tried to set him off to the races behind Chicago's backline. But it was never particularly successful. Late in the match, Bunbury was shifted out wide as Jerry Bengtson came on, and he promptly created a chance out of nothing by simply running really fast around Chicago's left back. I'd love to see more of that and less of Bunbury struggling up top in the future for New England.

Stat that told the story for Chicago: 11 turnovers in their own half by Bakary Soumare and Jhon Kennedy Hurtado

Chicago played well enough to win this game, and probably should have. If not for a poor penalty kick in stoppage time that was easily saved by Bobby Shuttleworth, the Fire would've left with three points instead of yet another draw. The draws are getting to be ridiculous for Chicago (6 in 7 games!), but they really have no one to blame but themselves. In addition to the penalty fiasco, the goal they gave up immediately followed one of those 11 turnovers by Chicago centerbacks. Patrick Nyarko was the one who gave up the penalty, but Soumare and Hurtado deserve at least a share of the blame. This was hardly an isolated incident for Chicago - their centerbacks have been shaky all season. Think they regret trading away Austin Berry right about now?


Agree with my ideas? Think I'm an idiot? I love to hear feedback: @MLSAtheist