Week 8: My PWP Pick List

Two weeks in and my PWP-Pick-List is doing pretty well: If you tracked my picks from last week I nailed the wins by Seattle, Real Salt Lake, Sporting, FC Dallas, and the two draws - Vancouver v LA Galaxy and Chicago v New England.  That's 5 for 9 in my first week (Week 6) and 6 for 10 in my second week (Week 7).

With that said, and if you've read my latest article on Expected Wins, (XpW) you'll know that I will no longer be picking draws as an outcome - granted they will happen, but since no team really goes into a game expected a draw then my picks won't either.

For now XpW won't be part of my PWP-Pick-List.  Each team has only played 5-7 games so far, and that's not enough individual sample points to support a reasonable correlation (R2) that has relevance.  Figure by Week 17 I'll start to include the R2 for each team (home and away games) and then by Week 24 I will start to separate out the R2 for Home games versus Away games.

For now my source in this effort is strictly my subjective view on the objective data that I collect as part of my Possession with Purpose analysis.

To begin, your Week 8 picks:

New York Red Bulls hosting Houston Dynamo:  This is a hard call; Houston has David Horst back but Sarkodie is missing due to that red card last weekend.  It seems to me that when all four of the back-four are in and playing this team is really tough to beat.  That being said the Red Bulls got two goals against an improving Union side last week and they don't have a short week to prepare like Houston.  Bottom line here is I see New York winning this game.

Seattle at home to Colorado:  Dempsey didn't score against Chivas but he didn't need to - instead he began to show his value in creating space and assisting others in scoring goals.  That additional value adds tremendous strength to the Sounders attack.  On the other hand, Colorado is no slouch when it comes to winning away games so this will be a huge test to the Seattle back-four.  Can they contain Brown?  I think so and Seattle wins...  though I wouldn't be surprised to see this game end 2-1 or 3-2 given the weaker center with the Seattle back-four.

Philadelphia travels to Montreal:  In short - I simply don't see Montreal winning, or even getting a draw at home against a Union side that probably could have done better this past weekend. The Impact have one of the poorest performing teams on both sides of the ball, and Klopas (imo) simply runs an archaic (direct attacking) system that no longer belongs in the MLS - more mounting losses for Monreal, and by the summer transfer window I could see Klopas being given the heave-ho.  Union win...

DC United entertain FC Dallas:  A resurgent DC United with a quality striking partnership of Johnson and Espindola is working well as Kitchen runs the single pivot.  A great matchup where DC United is likely to have more of the possession.  That said Diaz and the creative midfield for Dallas can win this one and keep their strong start alive.  If I would bet on a draw it would be this one but I think the edge goes to Dallas IF DC United win this one then the Eastern Conference really needs to be considered about the positive confidence they'll gain with three points.  If there was a game to be played on National TV this next weekend this would be a good one.

Columbus at home to New York:  A short rest for the Red Bulls against a well rested Crew that are probably disappointed they didn't take three points from DC United.  I think defense wins this game and in my view the defense for Columbus is better than what New York offers.  Crew win...

Sporting KC travel to New England:  The team formerly known as the wizards offered some offensive magic against a fast fading Montreal this past week and the Revolution will need to be in fine fiddle to control the volume of successful crosses I'd expect to see this game.  Can the New England defense hold and will the ability of the KC back-four be enough to contain a Revolution side who have struggled at times to score this season.  All told I'm not quite sure - I'd like to offer this as a draw as well but I think the improving attack, to go along with the best defense in MLS, gives Sporting the edge.  I won't always pick Sporting to win every game this year, and against some Western Conference teams I won't, but for now SKC wins.

Real Salt Lake at home to Vancouver:  Real continue to show quality versus quantity and they also continue to move up the ladder in my Composite PWP.  Vancouver had two very tough games against LA back to back and the wicked attack (with a healthy Plata) won't get any easier in Rio Tinto.  Real Salt Lake wins...

San Jose versus Chivas:  The Earthquakes have yet to win a game this year and no better opportunity to do that than this week.  Their continued use of crossing as a prime source for creating goal scoring opportunities should get them that three points provided Torres can be controlled in attack.  He's shown an ability to score as well so this one probably doesn't see either team getting a clean sheet but I do think the Earthquakes take three.

Portland travels to Houston:  Are the cards right for the Timbers to get their first three points?  We saw Nanchoff come on as a late sub and Valeri, along with Kalif and others, seemed to struggle with their passing accuracy.  Having vision and accuracy in tight spaces is what separated the Timbers last year from the Timbers this year.  That and a healthy, well communicating back-four led by Ricketts.  That being said Houston are coming into this game on short rest and Kinnear will want his players to stamp their irritating level of physical play early on.  This is likely to be a VERY physical game for both teams but the edge for the Timbers needs to be real sharp as they are simply fed up with not winning.  I think the Timbers find the back of the net and win.  If it's Urruti great; but in this game, Valeri needs to score.

All for now and not an easy thing for me to ignore picking draws - but I remain steadfastly stubborn and stubbornly steadfast that teams don't enter games with an intent to get one point - so in my picks I won't either.

Best, Chris

Expected Wins in MLS

Over the two and a half years I've been developing Possession with Purpose you've heard me go on about this game not just being about scoring goals it's about winning.  I don't mean that in the sense that you don't need to score goals to win; you do.  But what separates winning from losing statistics wise?  And if there is separation, what is it, and what value does it bring?

I'm not sure I have 'the' answers but I do have 'some' answers...

To begin here are the 7 primary data points I collect and calculate ratios with in my PWP Six Step Process analysis:

  1. Passes Attempted Entire Pitch
  2. Passes Completed Entire Pitch
  3. Passes Attempted Final Third
  4. Passes Completed Final Third
  5. Shots Taken
  6. Shots on Goal
  7. Goals Scored

I collect these data points for every team, for every game; all 646 from last year and up to 102 (61 Games) so far this year.

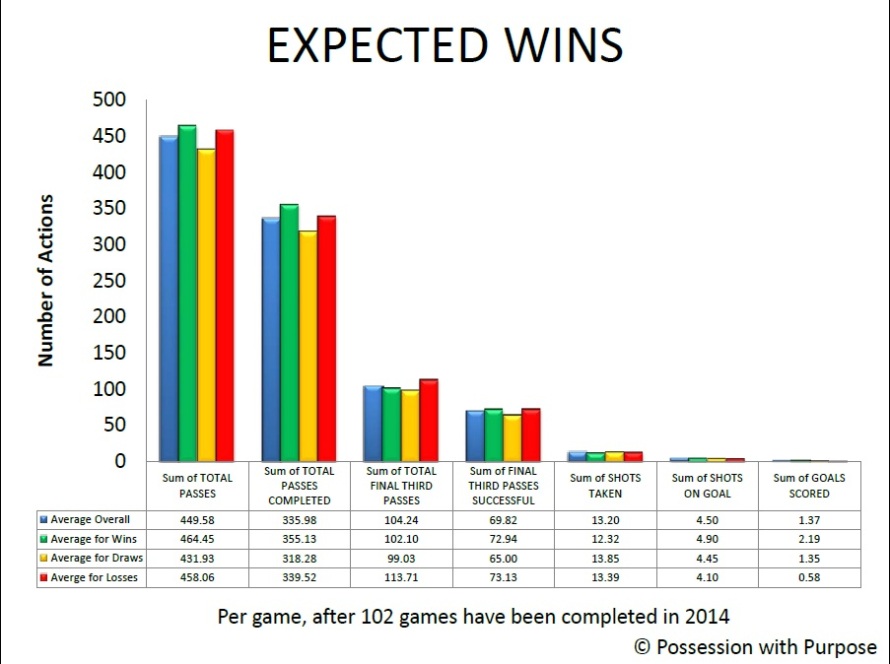
In looking at the data this year the below diagram offers up the averages of those 7 data points, for all games, up to the end of Week 6. 

The blue bar is the overall Average for all games regardless of points earned, the green bar is the Average for all games where teams took three points, the amber bar is the Average where teams took one point, and the red bar is the Average where teams got nil-pwa.  

Expected Wins PWP Data Points

Facts as they exist today after 102 games in 2014:

The table just beneath the bar graph indicates the raw numbers (averages); for example the average Successful passes for teams that lose (in the Final Third) is 73.13; their average Shots taken is 13.39; their average Shots on goal is 4.10 and their average Goals scored is .58.

Here are the percentages derived by comparing the relationship of each of these points(part of my PWP analysis) working left to right:

  • Teams that win average 50.30% Possession versus teams that lose average 49.70% Possession.
  • Teams that win average 76% Passing Accuracy across the Entire Pitch. /// teams that lose average 74% Passing Accuracy across the Entire Pitch.
  • Teams that win average 71% Passing Accuracy in the Final Third. /// teams that lose average 64% Passing Accuracy in the Final Third.
  • Teams that win average 22% of all their Passes Attempted in the Final Third /// teams that lose average 25% of all their Passes Attempted in the Final Third.
  • Teams that win average 17% Shots Taken vs Completed Passes in the Final Third. /// teams that lose average 18% Shots Taken vs Completed Passes in the Final Third.
  • Teams that win average 40% Shots on Goal vs Shots Taken. /// teams that lose average 31% Shots on Goal vs Shots Taken.
  • Teams that win average 45% Goals Scored vs Shots on Goal. /// teams that lose average 14% Goals Scored vs Shots on Goal.

Observations:

While 2% difference in overall Passing Accuracy might not mean much it should be noted as a reasonable indicator on how well a teams' Passing Accuracy will be in penetrating the Final Third.

That 2% difference translates this way.  When a team makes 500 pass attempts.  76% * 500 Passes equals = 380 Completed Passes.  74% * 500 Passes equals 370 Completed Passes.

Any one of those unsuccessful passes could be the pass that gets you that goal or leads to the Opponent making an interception (quick counter) that gets them a goal.

Perhaps it is easier to understand why some coaches say control of the game and possession adds value?  Those teams that are more accurate in their overall passing are more likely to win.

In looking at Passing Accuracy within the Final Third there is a clear difference between winners and losers; winning teams are 9% better in Passing Accuracy within the Final Third... this is not about volume of passes - it's about the accuracy of those passes.

To put that into perspective say a team attempts 100 passes in the Final Third; 71 of those passes (71%) are successful for the winning team whereas  only 64 (64%) are successful for the losing team.

That difference of 7 (within the tight confines of the Final Third) could make a BIG difference; those 7 extra completed passes could be 7 through-balls, key passes, or crosses that lead to a goal versus no goal.

Note that losing teams take more shots (on average) per pass completed (18%) than teams that win (17%).

Is that an indicator that the less effective team is trying to compensate for lower skill levels/overall passing accuracy by increasing their shots taken totals?  I think so.

And when looking at the ability of a winning team to put a shot taken on goal (a more accurate shot) the winning teams do that 9% better than losing teams.

And that initial accuracy then translates to a huge, if not inordinately large, difference between a team that wins versus loses; 45% of shots on goal are goals scored for winners versus 14% for losers.

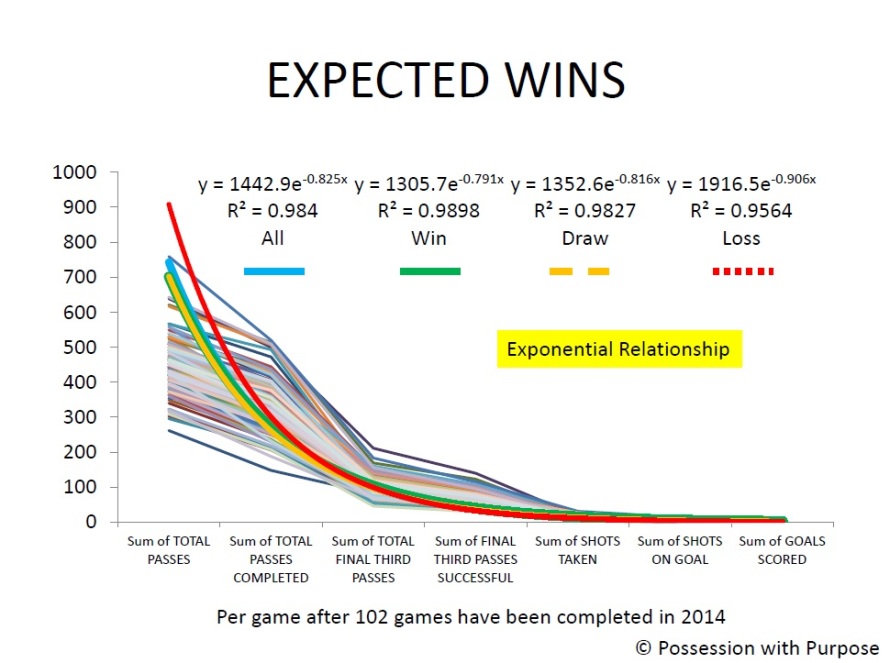
Now for the second diagram and the R2 for the overall average, wins, draws, and losses with the backdrop lines being the real numbers for all 102 games this year..

The "x and y" axis represent the same things as they did in the first diagram.  The Blue, Green, Yellow and Red lines represent the averages 'in trend-line format' seen in the above diagram with their corresponding exponential correlations.  

I selected the Exponential Relationship as opposed to a Linear Relationship because I think it best represents the drop off in passes (in total) versus those just within the Final Third; the R2 will remain the same regardless.


Expected Wins PWP Data Points Correlations

Observations:

First off - all those lines are the 102 games worth of data that populate the diagram - it is that data that also formed the 'averages' for the first diagram...

That tight difference in R2 means there is a very tight margin of error between winning, losing and getting a draw; and if you've watched a game you know a single mistake can cost you three points.

However tight, there is a difference between the R2 for winning teams versus losing teams.  Is that statistical difference associated with those percentage differences indicated in the first diagram?

I think so, and while Possession (itself) is not "the" prime indicator on whether a team wins or loses it is "an" indicator that should be considered, when viewing overall passing accuracy within and outside the Final Third.

Perhaps the TV pundits will take more time to show better graphics where the Final Third data (in possession percentage) is separated out from the overall possession data?

Perhaps another view that may be helpful to others is the 'space available' that gets leveraged in creating that goal scoring opportunity?

I don't know if this data is representative for teams in Europe - but the data certainly supports that view for teams in Major League Soccer.

To reinforce the End State (winning) from a different viewpoint. 

Last year the top five teams in volume of shots taken versus passes completed in the Final Third were Chicago, (26%), Philadelphia (26%), FC Dallas (26%), Montreal (25%) and Columbus (23%).

Only one of those teams made the MLS Playoffs - Montreal.

This year the top three teams with the highest volume of shots taken versus passes completed in the Final Third are Montreal (28%), Chicago (28%) and San Jose (26%); two of those three teams are the current bottom dwellers in the Eastern and Western Conferences.

In all this I've not talked anything about defensive play... more later this year on how teams perform without the ball with specific focus on defensive efforts (collectively and by individual defensive action) within the Final Third.

For now I offer these questions:

  • Do you think teams that defend better do so as a team (collectively) or is it individual actions like clearances, tackles, interceptions or recoveries that stand alone?
  • And does the general formation they play to (advertised as 'the formation' in the MLS recaps) show results differently in how a defense performs?
  • And does the relationship of the individual or collective defensive activities relate better to unsuccessful passes in the Final Third?

My intent will be to answer these questions, and more, as the data piles up (figure once the 17 game mark is reached, for most MLS teams, I will have enough to offer a reasonable view on what is and isn't of value.  With respect to the data discussed here - I have the 102 games here and the 646 games from last year.

When circling back to my overall PWP Composite Index - here it is put another way...

  • The Attacking Index is the relationship those seven data points have with respect to the six steps in the PWP Process.
  • The Defending Index is the relationship the Opponents seven data points have with respect to the six steps in the PWP Process.
  • The Composite Index is the difference between those two Indices.
  • This year, at this time, the overall Correlation of that analysis is an R2 of  .7658 - the R2 for Goal Differential is .8729.
  • The R2 for Goals Scored is .5083 and the R2 for Attacking PWP is .5865
  • The R2 for Goals Against is -.6754. and the R2 for Defending PWP is -.6225
  • Bottom line here is that the PWP Composite Index has the 2nd highest R2.  With that you should have a better feel for what goes on behind the scenes to get there as opposed to just looking at Goal Differential.
  • The more data points collected the more relevant the R2.
  • How this plays out by the end of the season is unclear but as a reminder the overall PWP Composite Index was 90% accurate by the end of the 2013 in showing what teams would make the playoffs and what teams wouldn't.
  • And two of the top three teams in the Composite PWP Index for 2013 were in the MLS Championship Finals...
  • Starting for Week 8 my PWP-Pick-List will offer up my prognostications about a team either winning or losing... no more draws will be offered up as no one team ever goes into a regular season game wanting to get a draw.  A draw is good but the intent of a Head Coach is to win first.

In closing...

The repeatable statistic in this effort is wins, draws and losses...

Expected Wins is all about what it generally takes to win a game versus lose a game; it's not about getting a draw.

Expected Goals is an 'effect' relative to Expected Wins and the 'causing' relationship between those seven data points; i.e. the combined effort of a team as it possesses, passes and penetrates with purpose.  Hence my phrase offreed up some time ago "quality beats quantity".

And yes, set-pieces win games, and sometimes the team getting those and scoring from those does that against the run-of-play; I suppose that is why the R2 for wins, draws, and losses is so close.

However viewed, teams play to win and score goals.  Various strategies and tactics may be used depending upon location, game state, game conditions, team formations, player selections, or what's needed to move on, if in a knock-out or other tournament type condition.

It will be interesting to see how this analysis unfolds for the World Cup this year... more to follow... Here is the link on more to follow for MLS this year... Expected Wins 2 (92 games /// 184 events)

Bottom line at the Bottom:  For the MLS, every team wants to win every game - those teams that are more successful in winning are those teams that:

  1. Have slightly more possession,
  2. Have better passing accuracy, 
  3. Have more patience in penetrating the Final Third,
  4. Take slightly fewer shots,
  5. Put more shots on goal and,
  6. Score more goals.

Best, Chris

Looking for the model-busting formula

Well that title is a little contradictory, no? If there's a formula to beat the model then it should be part of the model and thus no longer a model buster. But I digress. That article about RSL last week sparked some good conversation about figuring out what makes one team's shots potentially worth more than those of another team. RSL scored 56 goals (by their own bodies) last season, but were only expected to score 44, a 12-goal discrepancy. Before getting into where that came from, here's how our Expected Goals data values each shot:

  1. Shot Location: Where the shot was taken
  2. Body part: Headed or kicked
  3. Gamestate: xGD is calculated in total, and also specifically during even gamestates when teams are most likely playing more, shall we say, competitively.
  4. Pattern of Play: What the situation on the field was like. For instance, shots taken off corner kicks have a lower chance of going in, likely due to a packed 18-yard box. These things are considered, based on the Opta definitions for pattern of play.

But these exclude some potentially important information, as Steve Fenn and Jared Young pointed out. I would say, based on their comments, that the two primary hindrances to our model are:

  1. How to differentiate between the "sub-zones" of each zone. As Steve put it, was the shot from the far corner of Zone 2, more than 18 yards from goal? Or was it from right up next to zone 1, about 6.5 yards from goal?
  2. How clean a look the shooter got. A proportion of blocked shots could help to explain some of that, but we're still missing the time component and the goalkeeper's positioning. How much time did the shooter have to place his shot and how open was the net?

Unfortunately, I can't go get a better data set right now so hindrance number 1 will have to wait. But I can use the data set that I already have to explore some other trends that may help to identify potential sources of RSL's ability to finish. My focus here will be on their offense, using some of the ideas from the second point about getting a clean look at goal.

Since we have information about shot placement, let's look at that first. I broke down each shot on target by which sixth of the goal it targeted to assess RSL's accuracy and placement. Since the 2013 season, RSL is second in the league in getting its shots on goal (37.25%), and among those shots, RSL places the ball better than any other team. Below is a graphic of the league's placement rates versus those of RSL over that same time period. (The corner shots were consolidated for this analysis because it didn't matter to which corner the shot was placed.)

Placement Distribution - RSL vs. League


RSL obviously placed shots where the keeper was not likely at: the corners. That's a good strategy, I hear. If I include shot placement in the model, RSL's 12-goal difference in 2013 completely evaporates. This new model expected them to score 55.87 goals in 2013, almost exactly the 56 they scored.

Admittedly, it isn't earth-shattering news that teams score by shooting at the corners, but I still think it's important. In baseball, we sometimes assess hitters and pitchers by their batting average on balls in play (BABIP), a success rate during specific instances only when the ball is contacted. It's obvious that batters with higher BABIPs will also have higher overall batting averages, just like teams that shoot toward the corners will score more goals.

But just because it is obvious doesn't mean that this information is worthless. On the contrary, baseball's sabermetricians have figured out that BABIP takes a long time to stabilize, and that a player who is outperforming or underperforming his BABIP is likely to regress. Now that we know that RSL is beating the model due to its shot placement, this begs the question, do accuracy and placement stabilize at the team level?

To some degree, yes! First, there is a relationship between a team's shots on target totals from the first half of the season and the second half of the season. Between 2011 and 2013, the correlation coefficient for 56 team-seasons was 0.29. Not huge, but it does exist. Looking further, I calculated the differences between teams' expected goals in our current model and teams' expected goals in this new shot placement model. The correlation from first half to second half on that one was 0.54.

To summarize, getting shots on goal can be repeated to a small degree, but where those shots are placed in the goal can be repeated at the team level. There is some stabilization going on. This gives RSL fans hope that at least some of this model-busting is due to a skill that will stick around.

Of course, that still doesn't tell us why RSL is placing shots well as a team. Are their players more skilled? Or is it the system that creates a greater proportion of wide-open looks?

Seeking details that may indicate a better shot opportunity, I will start with assisted shots. A large proportion of assisted shots may indicate that a team will find open players in front of net more often, thus creating more time and space for shots. However, an assisted shot is no more likely to go in than an unassisted one, and RSL's 74.9-percent assist rate is only marginally better than the league's 73.1 percent, anyway. RSL actually scored about six fewer goals than expected on assisted shots, and six more goals than expected on unassisted shots. It becomes apparent that we're barking up the wrong tree here.*

Are some teams more capable of not getting their shots blocked? If so then then those teams would likely finish better than the league average. One little problem with this theory is that RSL gets it shots blocked more often than the league average. Plus, in 2013, blocked shot percentages from the first half of the season had a (statistically insignificant) negative correlation to blocked shots in the second half of the season, suggesting strongly that blocked shots are more influenced by randomness and the defense, rather than by the offense which is taking the shots.

Maybe some teams get easier looks by forcing rebounds and following them up efficiently. Indeed, in 2013 RSL led the league in "rebound goals scored" with nine, where a rebounded shot is one that occurs within five seconds of the previous shot. That beat their expected goals on those particular shots by 5.6 goals. However, earning rebounds does not appear to be much of a skill, and neither does finishing them. The correlation between first-half and second-half rebound chances was a meager--and statistically insignificant--0.13, while the added value of a "rebound variable" to the expected goals model was virtually unnoticeable. RSL could be the best team at tucking away rebounds, but that's not a repeatable league-wide skill. And much of that 5.6-goal advantage is explained by the fact that RSL places the ball well, regardless of whether or not the shot came off a rebound.

Jared did some research for us showing that teams that get an extremely high number of shots within a game are less likely to score on each shot. It probably has something to do with going for quantity rather than quality, and possibly playing from behind and having to fire away against a packed box. While that applies within a game, it does not seem to apply over the course of a season. Between 2011 and 2013, the correlation between a teams attempts per game and finishing rate per attempt was virtually zero.

If RSL spends a lot of time in the lead and very little time playing from behind--true for many winning teams--then its chances may come more often against stretched defenses. RSL spent the fourth most minutes in 2013 with the lead, and the fifth fewest minutes playing from behind. In 2013, there was a 0.47 correlation between teams' abilities to outperform Expected Goals and the ratio of time they spent in positive versus negative gamestates.

If RSL's boost in scoring comes mostly from those times when they are in the lead, that would be bad news since their Expected Goals data in even gamestates was not impressive then, and is not impressive now. But if the difference comes more from shot placement, then the team could retain some of its goal-scoring prowess. 8.3 goals of that 12-goal discrepancy I'm trying to explain in 2013 came during even gamestates, when perhaps their ability to place shots helped them to beat the expectations. But the other 4-ish additional goals likely came from spending increased time in positive gamestates. It is my guess that RSL won't be able to outperform their even gamestate expectation by nearly as much this season, but at this point, I wouldn't put it past them either.

We come to the unsatisfying conclusion that we still don't know exactly why RSL is beating the model. Maybe the players are more skilled, maybe the attack leaves defenses out of position, maybe it spent more time in positive gamestates than it "should have." And maybe RSL just gets a bunch of shots from the closest edge of each zone. Better data sets will hopefully sort this out someday.

*This doesn't necessarily suggest that assisted shots have no advantage. It could be that assisted shots are more commonly taken by less-skilled finishers, and that unassisted shots are taken by the most-skilled finishers. However, even if that is true, it wouldn't explain why RSL is finishing better than expected, which is the point of this article.

ASA Podcast XLIV: The One Where We Talk About What We Write About

Harrison and Matty discuss their two most recent articles, respectively about Harrison's Shots Created per 90 statistic and Matty's obsessive need to put RSL down because its players are more gooder at soccer than he is. It's a short one, perfect for your commute![mixcloud http://www.mixcloud.com/hkcrow/asa-podcast-xliv-the-one-where-we-talk-about-what-we-write/ width=660 height=180 /]

MLS Top 50: Total Shots Created

I've briefly mentioned the stat Total Shots Created before. Basically it's how frequently a player contributes to the moment leading to an attempt on goal. It's one that I like a lot in terms of crediting individual players for their single contributions to the team's efforts. Obviously there are other elements to a match that are also important and lead to definitive events that have predictive value (i.e. other things that players can do to help a team win). However, shots are one of the more valuable numbers out there and available. There is also the little fact that everyone loves goals. Goals are awesome and invoke celebrations. Shot deflections, all out blocked shots, or midfield recoveries hardly elicit the same reaction from friends but arguably hold near as much individual performance weight/value to the team. With all the emphasis on shots and individual production there is another number worth mentioning: %Tsh (Percentage of Team Shots). It's a pretty percentage of how many of the total team shots a player was involved in creating, not just shooting himself.

This time around, the list is compiled of the top 50 players in shot creation based upon the shots they've taken, assists that they've been attributed, or other shots they've created by their passing ability. Players below have been sorted by their %Tsh.

Player Club POS GP GS MINS G A SHTS KP SH-C ShC-90 Total Team Shots %Tsh
Federico Higuain CLB F 5 5 448 4 2 18 17 37 7.43 71 52.11%
Pedro Morales VAN M 6 4 407 1 2 14 14 30 6.63 67 44.78%
Fabian Espindola DC F 5 5 441 1 2 9 13 24 4.90 55 43.64%
Mauro Diaz DAL M 6 6 515 2 3 10 14 27 4.72 62 43.55%
Robbie Keane LA F 4 4 360 3 1 17 11 29 7.25 68 42.65%
Mauro Rosales CHV M 6 6 540 0 3 9 15 27 4.50 64 42.19%
Lloyd Sam NY M 6 6 531 0 3 11 16 30 5.08 74 40.54%
Landon Donovan LA M-F 4 4 360 0 2 12 12 26 6.50 68 38.24%
Giles Barnes HOU M 5 5 437 0 1 21 5 27 5.56 71 38.03%
Diego Valeri POR M 6 6 518 1 0 18 14 32 5.56 85 37.65%
Erick Torres CHV F 6 6 524 5 0 18 6 24 4.12 64 37.50%
Thierry Henry NY F 4 4 360 1 0 19 8 27 6.75 74 36.49%
Shea Salinas SJ M 0 360 0 3 2 18 23 5.75 69 33.33%
Alvaro Saborio RSL F 6 6 540 3 0 18 4 22 3.67 66 33.33%
Felipe Martins MTL M 6 6 536 1 2 18 12 32 5.37 97 32.99%
Justin Mapp MTL M 6 6 540 0 3 11 18 32 5.33 97 32.99%
Gilberto TOR F 4 4 333 0 0 12 8 20 5.41 62 32.26%
Michael Bradley TOR M 343 1 0 5 15 20 5.25 62 32.26%
Deshorn Brown COL F 5 4 366 1 0 16 4 20 4.92 62 32.26%
Teal Bunbury NE F 6 6 540 0 1 14 9 24 4.00 75 32.00%
Clint Dempsey SEA M 4 3 303 6 1 20 5 26 7.72 84 30.95%
Obafemi Martins SEA F 6 6 531 1 4 10 12 26 4.41 84 30.95%
Quincy Amarikwa CHI F 6 5 475 3 1 14 11 26 4.93 84 30.95%
Eddie Johnson DC F 5 5 441 0 0 11 6 17 3.47 55 30.91%
Graham Zusi KC F-M 4 4 360 1 2 8 14 24 6.00 78 30.77%
Diego Fagundez NE M-F 6 6 539 0 0 19 4 23 3.84 75 30.67%
Darren Mattocks VAN F 6 6 490 1 2 11 7 20 3.67 67 29.85%
Chris Wondolowski SJ F-M 4 4 360 3 0 17 3 20 5.00 69 28.99%
Joao Plata RSL F 3 3 207 2 2 9 8 19 8.26 66 28.79%
Leo Fernandes PHI F 5 3 326 2 1 12 8 21 5.80 74 28.38%
Dom Dwyer KC F 5 4 340 2 0 19 3 22 5.82 78 28.21%
Brad Davis HOU M 311 0 2 3 15 20 5.79 71 28.17%
Marco Di Vaio MTL F 3 3 270 1 1 22 4 27 9.00 97 27.84%
Fabian Castillo DAL F 6 6 539 2 0 15 2 17 2.84 62 27.42%
Will Johnson POR M 6 6 539 1 0 18 5 23 3.84 85 27.06%
Maurice Edu PHI M 6 6 540 2 1 11 8 20 3.33 74 27.03%
Hector Jimenez CLB M 5 5 433 0 2 6 10 18 3.74 71 25.35%
Lamar Neagle SEA F 6 5 416 1 2 13 6 21 4.54 84 25.00%
Mike Magee CHI F 4 4 360 1 2 13 6 21 5.25 84 25.00%
Will Bruin HOU F 5 5 449 3 1 11 5 17 3.41 71 23.94%
Bernardo Anor CLB M 5 5 416 2 0 13 4 17 3.68 71 23.94%
Kenny Miller VAN F 6 5 447 3 1 9 6 16 3.22 67 23.88%
Cristian Maidana PHI M 5 4 293 0 2 8 7 17 5.22 74 22.97%
Vincent Nogueira PHI M 6 6 540 1 1 10 6 17 2.83 74 22.97%
Michel DAL M-D 6 3 312 3 1 9 4 14 4.04 62 22.58%
Vicente Sanchez COL F 3 2 193 4 0 6 8 14 6.53 62 22.58%
Darlington Nagbe POR F-M 6 6 490 0 1 5 13 19 3.49 85 22.35%
Juninho LA M 4 4 358 0 2 7 6 15 3.77 68 22.06%
Benny Feilhaber KC M 5 5 449 1 1 7 9 17 3.41 78 21.79%
Kyle Beckerman RSL M 6 6 540 2 2 7 5 14 2.33 66 21.21%


This list below is sorted by total ShC-90, shot creation per 90 minutes. The one stipulation I would make is to be careful when looking at some of the numbers below. Guys like Justin Meram end up at the top of the list after playing just 58 minutes and scoring a goal in that short time. This leads to incorrect perceptions of certain players, as well as providing horrible and trite narratives like "Justin Meram is the most underrated player ever." That might be true, but probably not. Just look out for small sample sizes.


Player Club POS GP GS MINS G A SHTS KP SH-C ShC-90 Total Team Shots %Tsh
Justin Meram CLB M 5 0 58 1 1 5 2 8 12.41 71 11.27%
Yannick Djalo SJ M 2 0 56 0 0 6 1 7 11.25 69 10.14%
Marco Di Vaio MTL F 3 3 270 1 1 22 4 27 9.00 97 27.84%
Joao Plata RSL F 3 3 207 2 2 9 8 19 8.26 66 28.79%
Clint Dempsey SEA M 4 3 303 6 1 20 5 26 7.72 84 30.95%
Federico Higuain CLB F 5 5 448 4 2 18 17 37 7.43 71 52.11%
Robbie Keane LA F 4 4 360 3 1 17 11 29 7.25 68 42.65%
Kekuta Manneh VAN F 6 1 167 1 0 11 2 13 7.01 67 19.40%
Thierry Henry NY F 4 4 360 1 0 19 8 27 6.75 74 36.49%
Pedro Morales VAN M 6 4 407 1 2 14 14 30 6.63 67 44.78%
Vicente Sanchez COL F 3 2 193 4 0 6 8 14 6.53 62 22.58%
Landon Donovan LA M-F 4 4 360 0 2 12 12 26 6.50 68 38.24%
Graham Zusi KC F-M 4 4 360 1 2 8 14 24 6.00 78 30.77%
Dillon Serna COL M 2 1 106 0 1 5 1 7 5.94 62 11.29%
Dom Dwyer KC F 5 4 340 2 0 19 3 22 5.82 78 28.21%
Leo Fernandes PHI F 5 3 326 2 1 12 8 21 5.80 74 28.38%
Brad Davis HOU M 311 0 2 3 15 20 5.79 71 28.17%
Shea Salinas SJ M 0 360 0 3 2 18 23 5.75 69 33.33%
Giles Barnes HOU M 5 5 437 0 1 21 5 27 5.56 71 38.03%
Diego Valeri POR M 6 6 518 1 0 18 14 32 5.56 85 37.65%
Gilberto TOR F 4 4 333 0 0 12 8 20 5.41 62 32.26%
Felipe Martins MTL M 6 6 536 1 2 18 12 32 5.37 97 32.99%
Justin Mapp MTL M 6 6 540 0 3 11 18 32 5.33 97 32.99%
Mike Magee CHI F 4 4 360 1 2 13 6 21 5.25 84 25.00%
Michael Bradley TOR M 343 1 0 5 15 20 5.25 62 32.26%
Cristian Maidana PHI M 5 4 293 0 2 8 7 17 5.22 74 22.97%
Lloyd Sam NY M 6 6 531 0 3 11 16 30 5.08 74 40.54%
Chris Wondolowski SJ F-M 4 4 360 3 0 17 3 20 5.00 69 28.99%
Quincy Amarikwa CHI F 6 5 475 3 1 14 11 26 4.93 84 30.95%
Deshorn Brown COL F 5 4 366 1 0 16 4 20 4.92 62 32.26%
Fabian Espindola DC F 5 5 441 1 2 9 13 24 4.90 55 43.64%
Jermain Defoe TOR F 3 3 242 3 0 11 2 13 4.83 62 20.97%
Mauro Diaz DAL M 6 6 515 2 3 10 14 27 4.72 62 43.55%
Lamar Neagle SEA F 6 5 416 1 2 13 6 21 4.54 84 25.00%
Kelyn Rowe NE M 2 2 179 0 0 6 3 9 4.53 75 12.00%
Mauro Rosales CHV M 6 6 540 0 3 9 15 27 4.50 64 42.19%
Obafemi Martins SEA F 6 6 531 1 4 10 12 26 4.41 84 30.95%
Steven Lenhart SJ F 3 3 258 0 0 9 3 12 4.19 69 17.39%
Erick Torres CHV F 6 6 524 5 0 18 6 24 4.12 64 37.50%
Saer Sene NE M 6 4 286 0 0 8 5 13 4.09 75 17.33%
Michel DAL M-D 6 3 312 3 1 9 4 14 4.04 62 22.58%
Teal Bunbury NE F 6 6 540 0 1 14 9 24 4.00 75 32.00%
Juan Luis Anangono CHI F 6 1 113 1 0 5 0 5 3.98 84 5.95%
Sal Zizzo KC F 5 4 367 0 2 9 5 16 3.92 78 20.51%
Dwayne De Rosario TOR M 5 3 254 0 0 10 1 11 3.90 62 17.74%
Bradley Wright-Phillips NY F 5 2 278 1 0 9 3 12 3.88 74 16.22%
Diego Fagundez NE M-F 6 6 539 0 0 19 4 23 3.84 75 30.67%
Will Johnson POR M 6 6 539 1 0 18 5 23 3.84 85 27.06%
David Texeira DAL F 5 2 211 1 0 6 3 9 3.84 62 14.52%
Marco Pappa SEA M 4 2 165 0 0 6 1 7 3.82 84 8.33%


Overall, we're still just getting used to this statistic, but it seems like it could help dig a little deeper into valuing those players that don't always directly put the goal in the back of the net, but still play a key role in their teams' abilities to do so.

How It Happened: Week Six

I know, I know, week seven is already starting. It's not my fault the schedule-makers started putting games on Wednesdays - I can barely finish catching up on the previous week's games before the next weekend begins. Here come my thoughts on the three games I caught from last weekend: DC United 1 - 0 New York Red Bulls

Stat that told the story for New York: 135 passes; 36 crosses; 19 shots in attacking third

ny6


This game wasn't too much different than any others for New York this year - they played passably but were lackluster, especially in the final third. As the image above shows, Red Bulls certainly saw enough of the ball in the attacking third to get a goal. But far too many of the possessions in attack were basically in slow motion. The Red Bulls sent in 36 crosses, yet none of them led to a goal. To build to these crosses, New York slowly passed the ball around for two minutes then fiiinnnaallllyyy got the ball to the flank to be sent in. This slow play let DC's back line get set and ready for any attack. If New York wants to regain last year's Supporters' Shield form, they'll need to find some urgency in attack and build some moves before allowing the opposition to get settled.

Stat that told the story for DC: 1675 career MLS games played by starting eleven

This game wasn't terribly interesting from a DC standpoint (they nicked an early goal from a set piece, then defended resolutely to eke out a 1-0 win), so I'm going to use this space to wax philosophical about this team and the state of the league. United re-made their roster this offseason with veteran MLS players, so much so that the starting lineup this week averaged 152 career games. And that includes two guys who drastically bring that number down: Cristian Fernandez (new to the league this year) and Andrew Dykstra (the team's usual backup 'keeper). Now, experience doesn't mean talent, and a criticism can be made that DC lacks difference makers. But if you took this same roster and put them in the 2010 MLS season, I have trouble imagining that they would miss the playoffs. Here in 2014, they'll likely be in a season-long scrap for one of the final playoff spots. I don't mean this shpiel to diminish DC or their roster; I just want to make a point that MLS has clearly improved over the last several years to a point where even a very solid roster will have trouble making the postseason.

Toronto FC 0 - 1 Colorado Rapids

Stat that told the story for Toronto: 134 recorded actions for Kyle Bekker; 85 recorded actions for Jeremy Hall

tor6


Not all 1-0 soccer games are boring, but this one definitely was. Sorry. The biggest thing that I gleaned from this one about TFC had to do with their central midfield. Kyle Bekker, a high-potential but so far low-performance Canadian, put in a fantastic performance for the Reds. This is only one game and I'm prone to hyperbole, but he kind of looked like a young Michael Bradley in the way he commanded the game. Contrast that with the performance of his midfield partner, the veteran Jeremy Hall. Hall isn't the same type of player as Bekker, better suited to playing sound positionally than creating chances, but he was clearly less influential than Bekker. This isn't meant to be a criticism for either player or Toronto as a club - the fact is, these are the team's third and fourth central midfielders, which means they're pretty well off as far as MLS teams go.

Stat that told the story for Colorado: 4 central midfielders in the starting lineup

For the second game in a row, Pablo Mastroeni started a midfield of Jose Mari, Nathan Sturgis, Dillon Powers and Nick LaBrocca. All four of those guys are central midfielders by trade, putting them in a diamond shape that doesn't provide much width. The fullbacks (especially Thomas Piermayr) and forwards (especially Gabriel Torres) did a decent job of providing that width, but the cramped midfield still struggled at times. Moving the ball through the midfield was a task for the Rapids, and switching the field from one side all the way to the other flank was quite a task for the squad. It comes as no surprise that the game's only goal came from one of the few successful switches of field that the Rapids pulled off; they'll need to continue doing that in the future whether they stick with the diamond midfield or not.

LA Galaxy 1 - 0 Vancouver Whitecaps

Stat that told the story for LA: Robbie Keane & Landon Donovan's heat maps

LAG6


Last week I wrote about LA's diamond midfield and how successful it was against Chivas. I left out a big part of why this was successful: the interchanging of the forwards with that diamond midfield. In Robbie Keane and Landon Donovan, the Galaxy have a couple of special players who don't fit the mold of any particular type of striker. Both of these guys' heat maps were all over the place against Vancouver, and it was their checking to the midfield and midfielders' willingness to run forward into the space that made them hard to defend. LA only scored once, but they looked dangerous on many other occasions thanks to this interplay.

Stat that told the story for Vancouver: Russell Teibert: 5 recoveries, 3 interceptions, 2 clearances

Vancouver has been starting two defensive midfielders for most of this season, generally featuring Matias Laba and Nigel Reo-Coker. Reo-Coker's poor play to start the season led to his benching in Los Angeles, and they were forced to throw regular winger Russell Teibert into that role this weekend. He looked better there than the usual guys, mostly because he has so much ability as a chance creator. Teibert gets pigeon-holed as a pure attacker, but he actually showed a real good ability to break up midfield play and keep possession in the holding role. Teibert played there some for the 'Caps in preseason as well, so I'm not sure where he fits in their long-term plans. I for one would vote that he sees more time in a holding or box-to-box role: he was a major reason Vancouver wasn't stampeded a la Chivas in Week 5 and brings a spark going forward that can also be helpful in that position.

Agree with my thoughts? Think I'm an idiot? Let me know. @MLSAtheist

My PWP-Pick-List Week 7

It's a busy week for Philadelphia. If you get into Fantasy Football, it's my recommendation you have at least two players from the Union in your squad this week. Who they are is up to you - I have added Amobi Okugo and Raymon Gaddis. In considering my PWP Pick List this week, here are my prognostications based on not having any additional injury or suspension information than I was aware of Friday.

New York Red Bulls vs. Philadelphia Union:  Bottom line here is that the overall tenor of the attack and defending of the Union has been better this year than New York.  A more potent attack wasn't in the cards for the Red Bulls against DC United, and I'm just not seeing it happening here either.

Wenger added value early on, as did Edu later, against Real Salt Lake. That value should continue, provided Kimura still lines up as the right fullback for the Red Bulls. Yeah, it's hard to go against a team with the firepower of New York, but I'm just not linked in to seeing Mike Petke win a battle of chess against Hackworth - for whatever that means...  Union take 3 points - I hate saying that again, but it is what it is. If Eckerlsey lines up with Sakagya, Olave and Miller, then New York wins.

Chicago Fire vs. New England Revolution:  This is a tough one - both teams are performing well early. The hitch for the Revolution has been scoring goals while the giddy-up for Chicago has been a renewed attack with Amarikwa leading the way.  If Amarikwa gets a goal against the stingy defense of New England, the Fire remain on fire. Otherwise I can see this game finishing in a nil-nil draw.

Philadelphia Union vs Houston Dynamo:  I'm not sure why I feel this way, but my thinking is the Union defense won't be able to contain a renewed dynamic Dynamo, with a return of David Horst and a focused Will Bruin (one of the more normal #9's in MLS) after having just played 3 days ago against a Red Bulls teams that was itching for it's first win. I don't see this as a high scoring game but Houston gets my head nod this week.

Colorado Rapids entertain San Jose Earthquakes:  A solid three points last week saw the Rapids take advantage of an injury depleted Toronto side. San Jose continues to have one of the poorer performing defenses across MLS this year and I see the Rapids rapidly taking advantage of that. Might we see Brown get the nod to start against what I consider to be a slower defensive center-back pairing of Bernardez and Goodson?  Rapids win.

Vancouver returning home to face LA in a quick back-to-back out West:  Hard to see Vancouver take three points here against a team that completely dominated the PWP six-step process against them just this past week; the Whitecaps will be lucky to escape with a draw but I think they can in the friendly confines of BC Place. If not, LA is slamming its foot down early this year and, like Seattle, if they can muster points early on this season, then most of the other teams will be chasing the Galaxy.

Columbus Crew vs DC United:  Can DC win three on the trot - not likely if Columbus are healthy and firing on all cylinders.  Berhalter was probably okay with 1 point traveling out to San Jose this past week, but three points are three points. To set the tone for a continued presence atop the Eastern Conference, this is a game the Crew should win; 3 points to Columbus.

FC Dallas entertains a still hurting Toronto:  If Toronto is going to win this game, they need to contain a very aggressive Dallas attack - an approach like they had against Seattle would do well for the Reds.  Is everyone healthy? If so, I think the passive aggressive Reds can take three points in Dallas - if not then Dallas probably puts at least one past Toronto and wins at least 1-nil.  Expect Toronto to have no more than 40% of the possession this game... key is Defoe and Bradley teaming up to penetrate the weak center of Dallas.

Sporting Kansas City vs Montreal:  I may get burned on this one, but I think this is a no-brainer; Sporting take 3 points against a Montreal team that will probably have poor possession, poor penetration and poor results in shots on goal against one of the best defenses in MLS.

Real Salt Lake vs Portland Timbers:  Wow - talk about a tough hill to climb so early in the season for Portland. What should have been 3 points melted away in the final 20 minutes to one point against a Chivas side that actually had 52% of the possession against Portland.  Talk about a difference between one year and the next - if memory serves, the last time Portland entertained Chivas at home, they won putting three goals past the Goats.  And in their last game of the season the Timbers put five past Chivas while having ~54% of the possession.  I just don't see the Timbers taking three points here against the greatest nemesis of 2013 - Real wins.  As a supporter of the Timbers, it really pains me to say that, but if Portland is going to turn this season into a positive before mid-April, then their defense REALLY needs to get better...

Chivas USA vs Seattle Sounders:  It would be surprising, very surprising, to see the Goats take 3 points - or even 1 point - against Seattle.  With Dempsey beginning to find his role (in attack and defense) I just don't see Chivas scoring unless they really abuse a slower Marshall in the center - otherwise there are simply too many attacking angles that the Sounders can offer - if there is a blowout this weekend it's likely to come here as Seattle take 3 points.

That's all for now - I was five for nine last week - not bad. It's always a dodge to offer up prognostications, but there you have it.

Next up my Cumulative PWP Indices through Week 6.

All the best,

Chris


MLS PWP through 6 Weeks: Does the wheat begin to separate from the chaff?

You might not think that six weeks is enough to begin to categorize what teams are performing well and what teams aren't - I may even agree with you to an extent, but here's the thing: we're six weeks in, and patterns are beginning to take shape. Instead of just showing the combined Index for all 19 teams I'm going to split them up into the Eastern and Western Conferences to show a different view.  And here's my link to the Introduction to PWP.

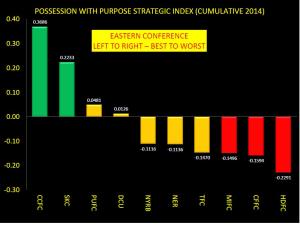
Here's all the Eastern Conference teams up after 6 weeks (note some teams have yet to play six games):

Eastern Conference PWP Strategic Composite Index Cumulative to Week 6

Observations:

The intent here is to offer up a graphic that shows which teams are performing better in attack than their opponents so far. No intent here to write off anyone, yet... too early for that with 28 games and a maximum of 84 points still being available.

Let's just say that Berhalter and Vermes have their teams in top gear - while Hackworth, Olsen, Petke, Heaps and Nelson are still fine tuning... as for Klopas, Yallop and Kinnear performance needs to get better and I'm sure they already know that.

As a reminder - this Index is the difference between how well a team executes the six primary steps of Possession with Purpose versus how well their opponents execute those same steps against them. A negative number thus means that, on average, the opponent is performing those six steps better (collectively) than that team.

I'm not a betting man yet on this Index, but if you think the odds are good that Columbus wins the Eastern Conference, then a flutter of $20/20 BPS might be a worthy chance. Spreading your bet across the field with Sporting Kansas City and one or two other teams might be worthy as well... for now I'm not seeing Montreal make it; but that's just me.

On to the Western Conference:

Western Conference PWP Strategic Composite Index Cumulative to Week 6

Observations:

Like the Eastern Conference, it's too early to go too deep, and the high flying teams play each other three times this year just like those guys back east; when LA and FC Dallas square off it should be interesting...  all the while Colorado and Seattle continue to get better, with Vancouver and the ever present/haunting Real Salt Lake looking to make a strong mid-year run.

As for Portland - times are hard early on this year and a 15-game unbeaten streak would be a much needed does of medicine to put them into the thick of things. How San Jose and Chivas cope remains to be seen - and given the styles I've seen from them this year, it appears crosses are their primary way to penetrate.

If you're a betting guy, I'm even less sure about the West than the east at this point - for now spreading the bets where the odds are good seems a likely choice with LA probably being the front-runner... is this the year where big money shows value in the West, like New York garnered last year in the East?

As for the top performing PWP attacking teams in general; here's how they compare against each other across all of MLS:

PWP Strategic Composite Attacking Index Cumulative to Week 6

Observations:

While there is no sure thing if you're looking for teams who are more likely to put goals past their opponents in multiples it's likely the top 5-10 teams are those that can - whether they prevent the same number of goals is a different story.

Note Real Salt Lake is in the top 7 here but sits in 6th place overall in the Western Conference PWP - for me that indicates Real are operating pretty much like they did last year; score goals and work harder than your opponent to score more goals while relying on your defense to keep you in the game... without that stoppage time goal by Edu this past weekend it's likely RSL would have been higher up the Western Conference PWP Index.

Note also that Sporting remain in the top ten for Attack - they've always been viewed as a great defending side - the higher up the attacking scale they reach the more likely they will be balanced for another run at the Championship.

On the other end - New England and Toronto are bottom dwellers here but they are getting points; why so low?  In working their own style Toronto have started the season averaging just over 40% of the possession with just 64% accuracy in their overall passing - what we are seeing is timely penetration against opponents who are out of shape, position wise (for the most part) - recall also Defoe has been injured too.

As for New England - their accuracy and possession numbers are solid - where things drop off are their ability to create shots taken (2nd lowest in MLS so far this year) and their ability to convert those shots taken into shots on goal and goals scored.  Their goals scored percentage based on shots on goal is just 12.22%.  That is the lowest goal scoring conversion rate in MLS - and a whopping 56% points lower than FC Dallas - who have converted (on average) 68.33% of their shots on goal to goals scored...

Other notable pieces of information - both Columbus and LA are averaging better than 80% accuracy in 'all' passing totals; the teams doing the best in penetrating based upon total passes are New England (29.49%) with Houston, Columbus, Philadelphia and Chicago all hovering around 22%.  The team creating the most shots given their final third penetration is San Jose at 26%, Toronto at 25% and Chicago at 25% - can you say counter and direct attack (be it on the ground or in the air)?

The teams most successful in putting shots on goal compared to shots taken are Colorado (42%) Real Salt Lake (42%) Vancouver (41%) and FC Dallas at (40%)...

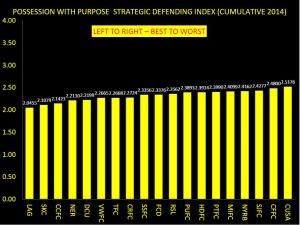
Moving on to the Composite PWP Defending Index...

PWP Strategic Composite Defending Index Cumulative to Week 6

Observations:

Not much separates the good from the not so good and perhaps the ugly; and it's too early to label anyone as really ugly.

For now the team most successful in holding their opponents to low passing accuracy percentages are Sporting KC (opponents just 70.25% accurate per game) with Real holding opponents to 71.97% accuracy, DC United 71.98% accuracy and Philadelphia holding opponents to 71.55% accuracy.

As for allowing penetration based upon overall passes; opponents of San Jose penetrate over 24% of the time while Vancouver also permits opponents to penetrate about 24% of the time.

In opponents completing final third passes the team most successful in limiting completed passes in their defending third is LA at 12% while Toronto's defense offers up a stingy 13.57%.

The teams allowing the most shots taken versus passes completed in their defending third are Chivas at 41.65% and New York at 40.55% - you wonder why I keep harping on New York that's why... they just don't defend that well in their own final third...

Teams yielding the most goals scored per shots on goal, per game, are Chivas at 45% (begging the question: why couldn't Portland score more than one goal?), Philadelphia at 43% while LA Galaxy allows a stingy 17% of their opponents shots on goal converted into goals scored.

In closing...

Just week 6, but patterns continue to develop - as the season unfolds I'll do my best to offer up these tidbits for your consideration.

For the future, I have a post coming up that speaks to formations and defensive activities - still need about 4 more weeks for that one to have enough data to offer some observations on it.

All the best, Chris

You can follow me on twitter at @chrisgluckpwp


New England tops the MLS PWP Team of the Week 6

Those living up near the northeast coast of America should be pretty chuffed with that result this weekend against Houston - an early season defensive-minded team came in to visit, and the Revolution re-educated Kinnear and his Dynamo on what a defensive-minded team really looks like.

I'll get to that in a minute, but before doing so, my link to what PWP is all about and then my recap on my PWP-Pick-List for last week and how the end results shook out.  In the future, look for the Pick-List in its own post.

Here's what I said in my "PWP-Pick-List" and then just beneath the outcome:

  • Real Salt Lake at Philadelphia - Given the PWP pedigree of Salt Lake I'm not seeing Philadelphia win this game; as for the addition of Wenger and how he influences things - hard to say. In my view it is more likely Edu and/or Okugo lend more value than Wenger at this time. RSL wins...
  • Philadelphia drew with Real Salt Lake on a late equalizer by Maurice Edu as both he AND Wenger added value.... noted.    (Miss)


  • Colorado at Toronto - Tough one here but I am going with a win to Colorado. It's early yet and the Rapids remain a strong attacking team, even on the road (4 points on the road already). That coupled with numerous injuries in Toronto I see the Rapids taking 3 points against the depleted Reds.  (Hit)
  • Colorado beat a depleted Toronto 1-nil...


  • Chicago at Montreal - Truly an interesting game between Yallop's style and Klopas's style. I had originally considered this might end in a draw but after thinking a bit more about how weak the PWP Defense was in Chicago last year (under Klopas) and how weak the Montreal defense is looking this year (under Klopas) I think Chicago takes 3 points.
  • Chicago and Amarikwa got a draw - if Quincey isn't on your Fantasy team he should be... (Miss)


  • Houston at New England - That red card really hurt Houston and perhaps Brunner? gets the head nod to replace Horst. As for the Revolution - they have a solid defense but can they score? I think Houston can get at least one goal up north - I'm just not seeing the same for New England... Houston wins.
  • New England scored two goals and Houston were shutout - is anyone surprised the New England defense did so well?  If you are looking for a 'team' Fantasy in defense you may consider the Revolution as a good place to focus; I know I've moved on from Houston...  That'll teach me to go against what I usually believe - defense will win you a game more often than attacking... (Miss)


  • New York at DC United - A real early test for both teams. The defense for New York really hasn't been that good and DC are beginning to take shape. New York wins if Sekagya and Olave pair up as center backs with Eckersley returning to partner Miller as the fullbacks. If Kimura starts at right back I think DC United wins. Rumor has it Miller is injured - does that put Convey as the left fullback? If so don't forget the 4-1 loss to Vancouver with Convey playing left fullback...
  • DC United took three points - Kimura started and New York lost - granted that loss isn't directly down to Kimura as Alexander blew his man to man coverage on the far post of that corner ball combination - but - Eckersley is stronger... (Hit)


  • Seattle at FC Dallas - Another tough road match for the Sounders coming off a lucky tie against Portland last week. In all fairness the Timbers dominated large parts of that game and they exposed the weak center of Seattle. But FC Dallas also have a weak center - this could be another 3-3 draw but the edge goes to Seattle with Traore returning as center-back in place of a very weak defending Anibaba.
  • Seattle beat Dallas - Traore played and Dempsey got a brace - and no I'm not going to say he got a 'due..'   (Hit)


  • Chivas at Portland - Can I really opine anything different than 3 points to Portland? I'll put it this way: if they don't get three points against a very disorganized defense like Chivas there may be major issues in Soccer City USA.
  • Chivas came from behind as open space came available late on... the defense continues to be an issue in Portland... (Miss)


  • Vancouver at Los Angeles - I'm not sure anybody beats LA in LA this year. LA wins.
  • LA took three points... the diamond continues to dazzle in Stub-hub with Keane scoring the lone goal. (Hit) 


  • Columbus at San Jose - Challenging home game for San Jose and they need three points against a strong Eastern Conference team. For now, I don't see them doing that regardless of how many crosses they put into the box. Most likely a draw here...
  • Columbus got goal 1 and San Jose, through Salinas to Wondolowski, got the draw... (Hit)

All told - in my maiden pix for week six - I was five out of nine... with three of my four losses coming via 2nd half equalizers by the teams I picked to lose - bollocks...

By the way - in case you missed it before here is a link to my PWP introduction...

Now for this weeks PWP - here's the Composite Index for Week 6 (only):

Observations...

No question here that New England were the top performing team this week. A 2-nil shutout (at home) should be a warning to the rest of the Eastern Conference that Jay Heaps has his team beginning to perform at its best.

What's really good to see about this team is how well the fullbacks integrated into the attack without forgetting that the first job is defense.  In a league where I think defense is considered a second-class citizen, the Revolution don't play that way... for me a welcomed site.  More to follow...

A late surprise for me was seeing how well Philadelphia performed this past weekend against a very strong Real Salt Lake - granted it was the 90+ minute mark before Edu equalized, but there's never a wrong time to score - there's only a wrong time to give up a goal.

The LA Galaxy got the expected result against Vancouver - the overall outputs from LA this game were just stunning... they offered up 617 passes; more than 500 of them completed with over 100 of those within the final third - I didn't watch the game but it is likely the Vancouver defense was pulled and pushed and poked to exhaustion.

That being said, the achilles heel for Vancouver last year was their defense - although they lost 1-nil they did a pretty good job all things considered - so the result didn't go in their favor but they should take some positives away from that game in how well they maintained the LA attack around that lone goal by Keene.

On the flip side - Houston started the season quite strong and it is likely Kinnear will get them firing on all cylinders again.

What was missing - at least in my view - was David Horst; that red card was double punishment for the Dynamo last week and his return should bring back a more solid back four.

With that said - and seeing how things continue to develop - I have begun my swap out my Dynamo defenders on my Fantasy team - I'll begin to rotate in a couple of New England players and maybe someone from DC United?  More to follow on that thought in my Cumulative PWP Index article later this week.

Moving on to my PWP Attacking team of the week...

Observations:

A surprise for some I'm sure - the winner this week is a team that drew 2-2 - while Seattle and Clint Dempsey traveled to FC Dallas and took three points... why?

For me it's down to the tenor of the overall attack - here's the differences (by the basic numbers) between those two teams this week - Philadelphia had the edge in possession (~55% to ~50%); their overall passing accuracy was ~76% compared to ~74%; while Seattle penetrated more often (23% to 20%) and put more shots on goal (46% vs 15%), the Union converted their two shots on goal into two goals scored (100% to 50% for Seattle)...

In a few words that means Seattle had more quantity in creating chances within the final third while the Union had more quality with their fewer chances... this has been the norm for many teams this past year-and-a-half within my PWP analysis - quality will beat quantity - not just in the statistics of the game, but in the regular run of play in the game.... it's always good to see statistics support what the eye sees.

Bottom line here though isn't the intent to minimze the success of Seattle - they took three points and Dempsey had another stellar game - but when looking at the comprehensive view of the game - more of the overall PWP parts of the game were executed better by Philadelphia than Seattle.

Other thoughts - Real Salt Lake performed in the top ten again as did FC Dallas and LA Galaxy - Portland edged its way into the 7th position this week and with that draw to Chivas it's a double-edged sword for Porter - the Timbers continue to improve in the overall attack - but they also continue to lack focus for a full 90+ minutes in defense.

How long before we see the Timbers begin to shake the trees to see what falls out for a defensive addition in the summer transfer window - perhaps another double-edged sword was the inclusion of Michael Harrington into the USMNT training scheme - has that reward created an issue for Harrington?

Both he and Kah were directly accountable for that poor man-marking in the box against Chivas; a mistake for Harrington that compounds his schoolboy mistake on closing down Neagle last week, which gave Neagle the room to turn and put in that devastating cross that saw Dempsey bring Seattle within one goal a week ago.

The PWP Attacking Player of the Week was...

Observations:

It's six weeks in and the top Attacking PWP Player of the week is another midfielder - go figure. Two years ago I opined that the most influential players in attack should come from the midfield, given their increased touches on the ball and their overall vision of the game from the center of the pitch.

Duly noted - Maurice Edu got a late equalizer and the Union fought back for a hard won draw against (IMO) the best team in MLS.

Evidence of Maurice's two way influence is above - enough said - this midfield acquisition continues to help the Union etch their place as a top team in the Eastern Conference, and grabbing a late point helps them sustain that Playoff vision.

On to the Defending Team of the Week... my favorite part of this game.

Observations:

I'll offer the Index a bit later; for now here's how New England's opponent (Houston) performed in the six steps of my PWP Index process...

Note the final three steps in the overall attack mounted by Houston - only 13% of their overall penetration generated a shot taken, and none of those shots were on goal. Consequently, none of those shots got past Shuttleworth--pretty stingy if you ask me. Their passing accuracy was below average, but with an average amount of possession.

If you had to paint a picture of a team that defends across the entire pitch, it's results like these that you want to see from your opponent's attack (i.e how well your team defense performs in controlling the opponent's attack).

Here's the overall Defending PWP Index for all 19 teams...

Observations:

Consistency begins to show for many teams this year - a welcome surprise for Olsen is that his team is beginning to shut down their opponents. D.C. United comes in 4th place this week against a very strong New York Red Bulls attacking side (at least they were last year).

Colorado traveled to Toronto and did well--aye the Reds had some injuries, but every team this year will experience players who get injured or miss a game through disciplinary reasons. Toronto got edged out by an improving Colorado.

On the tail end was FC Dallas, an unusual spot for them this year. The own goal, as well as the brace by Dempsey, speaks volumes - yet as we saw on the Attacking side of PWP, Seattle were also pretty strong across the entire pitch -- the center of FC Dallas defense remains and issue and Keel did not add value in pairing up with Hedges.

Now for my PWP Defending Player of the Week...

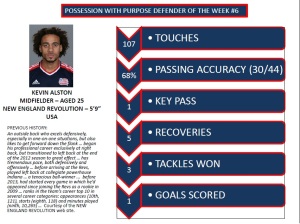
PWP Defending Player of the Week 6

Observations:

I like fullbacks who add to the attack, but I love fullbacks who defend first - there's a reason these guys are in defense; it's to stop the opponent first.

Overall, Alston did a superb job in playing his role; he not only scored, but he was also five for five in throw-ins within the final third - you'd be surprised - but at least four teams this week couldn't complete over 70% of their throw-ins within their attacking third... never take a throw-in for granted.

Another storyline here is that Alston continues to work through very difficult health issues from the past - showing concentration and doing his job to support his team translates to strong character. In a country where I think good fullbacks are not the norm, it is good to see Kevin have a great game!

In closing...

Next up will be my PWP Pick-List for Week 7 followed by my PWP Cumulative Indices and associated thoughts. For now know that the top team in each conference is not the top team in my overall PWP Cumulative Index - lest we forget not everyone has played six games yet.

All the best, Chris

You can follow all my PWP analysis through twitter: @chrisgluckpwp

Real Salt Lake: Perennial Model Buster?

If you take a look back at 2013's expected goal differentials, probably the biggest outlier was MLS Cup runner up Real Salt Lake. Expected to score 0.08 fewer goals per game than its opponents, RSL actually scored 0.47 more goals than its opponents. That translates to a discrepancy of about 19 unexplained goals for the whole season. This year, RSL finds itself second in the Western Conference with a goal differential of a massive 0.80. However, like last year, the expected goal differential is lagging irritatingly behind at --0.77. There are two extreme explanations for RSL's discrepancy in observed versus expected performance, and while the truth probably lies in the middle, I think it's valuable to start the discussion at the extremes and move in from there.

It could be that RSL plays a style and has the personnel to fool my expected goal differential statistic. Or, it could be that RSL is one lucky son of a bitch. Or XI lucky sons of bitches. Whatever.

Here are some ways that a team could fool expected goal differential:

  1. It could have the best fucking goalkeeper in the league.
  2. It could have players that simply finish better than the league average clip in each defined shot type.
  3. It could have defenders that make shots harder than they appear to be in each defined shot type--perhaps by forcing attackers onto their weak feet, or punching attackers in the balls whilst winding up.
  4. That's about it.

We know are pretty sure that RSL does indeed have the best goalkeeper in the league, and Will and I estimated Nick Rimando's value at anywhere between about six and eight goals above average* during the 2013 season. That makes up a sizable chunk of the discrepancy, but still leaves at least half unaccounted for.

The finishing  ability conversation is still a controversial one, but that's where we're likely to see the rest of the difference. RSL scored 56 goals (off their own bodies rather than those of their opponents), but were only expected to score about 44. That 12-goal difference can be conveniently explained by their five top scorers--Alvaro Saborio, Javier Morales, Ned Grabavoy, Olmes Garcia, and Robbie Findley--who scored 36 goals between them while taking shots valued at 25.8 goals. (see: Individual Expected Goals, and yes it's biased to look at just the top five goal scorers, but read on.)

Here's the catch, though. Using the sample of 28 players that recorded at least 50 shots last season and at least 5 shots this season, the correlation coefficient for the goals above expectation statistic is --0.43. It's negative. Basically, players that were good last year have been bad this year, and players that were bad last year have been good this year. That comes with some caveats--and if the correlation stays negative then that is a topic fit for another whole series of posts--but for our purposes here it suggests that finishing isn't stable, and thus finishing isn't really a reliable skill. The fact that RSL players have finished well for the last 14 months means very little for how they will finish in the future.

Since I said there was a third way to fool expected goal differential--defense. I should point out that once we account for Rimando, RSL's defense allowed about as many goals as expected. Thus the primary culprits of RSL's ability to outperform expected goal differential have been Nick Rimando and its top five scorers. So now we can move on to the explanation on the other extreme, luck.

RSL has been largely lucky, using the following definition of lucky: Scoring goals they can't hope to score again. A common argument I might expect is that no team could be this "lucky" for this long. If you're a baseball fan, I urge you to read my piece on Matt Cain, but if not, here's the point. 19 teams have played soccer in MLS the past two seasons. The probability that at least one of them gets lucky for 1.2 seasons worth of games is actually quite high. RSL very well may be that team--on offense, anyway.

Unless RSL's top scorers are all the outliers--which is not impossible, but unlikely--then RSL is likely in for a rude awakening, and a dogfight for a playoff spot.


*Will's GSAR statistic is actually Goals Saved Above Replacement, so I had to calibrate.