Shots in the Dark: how data providers tell us different versions of what happened

Shots in the Dark: how  data providers tell us different versions of what happened

Recently, this tweet created a small firestorm in the soccer analytics community. While it is unclear the source of the error, it was pretty clear that there weren’t 1,300 passes and 50 shots in an English League 2 match. This led to responses from prominent analysts such as StatsBomb’s Ted Knutson (including on his podcast [starts at 10:45]), Opta’s (and ASA alum) Tom Worville and Ryan Bahia, and Chris Anderson, author of The Numbers Game. All of them were saying pretty much the same thing: question the data you are using. If the data you are using to analyze a problem is not valid, then your solutions won’t be either.

So what do we know about the data that is used for soccer analysis? Previous studies have shown that people are pretty good at agreeing about what type of event occured in a soccer game (e.g. shots, tackles). But as far as I can tell, the accuracy and precision of locations  of game events among the various data providers has not been studied. As Joe Mulberry pointed out when looking at the troubling inconsistencies between spatial tracking data and event data, small differences in locations can have big effects on downstream analysis including expected goals (xG) models. In other words, small inconsistencies in how data is tracked can have big consequences for the models built off that data. So what are the differences between how soccer data providers collect and report their data?

Read More

MLS Television Blackouts: When Emotion and Data Collide

MLS Television Blackouts: When Emotion and Data Collide

Major League Soccer placed a calculated bet a few years back. They wagered they had core fans for life while they went searching for more marginal fans. The first part of this bet became public when MLS announced that ESPN had exercised their right to stream out-of-market games, and they would fold their digital streaming service MLS LIVE. All out-of-market content would move to a new ESPN+ app. It was sold as a great deal for existing fans. MLS Live was running at $70+ per season and the ESPN+ app was under $60 per year, and there was more content available. Sounds like a win, right?

But MLS LIVE wasn’t just an out-of-market service, because thirteen teams in 2017 did not exercise a blackout policy for their local games. Blackouts happen when a game is not televised for a specific group of people. They are very frustrating for fans who have paid for a service yet aren’t able to watch the game on a channel they thought they had paid for. The benefit of MLS LIVE was that fans of those thirteen teams that had severed ties with cable (aka "cut the cord") could watch their local team with the app. As a cord cutting Philadelphia Union fan, one of the teams that did not enforce blackouts, I was very happy with MLS LIVE.

Read More

Pressing, Defensive Lines, and What Defensive Actions Correlate with Goals

Pressing, Defensive Lines, and What Defensive Actions Correlate with Goals

How do you analytically measure a high defensive line and defensive pressing (see StatsBomb pressing index and Jamon's piece from a couple weeks ago)? Do we have enough data and information to analyze this behavior? If we do, how do these tactics impact the performance of a team?

Read More

MLS vs NCAA Passing Styles, Part 2

My opening post “came in stats up” was on the issue of substitutions and season length in college soccer, which I analyzed through a breakdown of passing styles in MLS and the ACC. If you haven’t already read that article, please do – it is an important primer for what you’re about to read. Here’s a brief summary for those of you who choose not to, centered around the chart that got everyone talking, after the jump.

Read More

Individual Defensive Statistics: Which Ones Matter and Top 10 MLS Defenders

When a car breaks down, a mechanic's job is to tell you what caused the failure. He or she can generally pinpoint the problem to a specific part reaching the end of its useful life. But have you ever asked a mechanic why your car is working fine? Or which part deserves the most credit for your car running smoothly? Of course not. That would be a waste of everyone's time. There are many parts to a car and all are doing their job as designed. We never ask why when things are going well. The same dilemma exists in assessing soccer defenders. After all, most of how we assess defenders has to do with what goals were not scored. And when all the parts of the defenses are working as designed, goals are avoided. But which defenders deserve the credit when goals aren't scored? It's like the pointless car question, which parts of the car deserve the most credit when the car runs smoothly?

To even begin this conversation we need to take stock of what data exists for soccer defenders. And just to be clear, I am going to steer clear looking at a defender's offensive capability. I want to focus solely on defensive statistics. Whoscored is the only site that offers a collection of defensive statistics, and here is what they have and their definitions.

  • Blocked Shot: Prevention by an outfield player of an opponents shot reaching the goal
  • Clearance: Action by a defending player that temporarily removes the attacking threat on their goal/that effectively alleviates pressure on their goal
  • Interception: Preventing an opponent's pass from reaching their teammates
  • Offside Won: The last man to step up to catch an opponent in an offside position
  • Tackle: Dispossessing an opponent, whether the tackling player comes away with the ball or not

These are the defensive-oriented statistics offered by Whoscored that are tracked at the individual player level. Of course, the other vital defensive statistic is shots conceded but those can't be attributed to any one player. So then, do any of these statistics matter? First there are a couple of assumptions to iron out.

A defender should be judged by the rate at which he accumulates statistics. So to get to that number we need to adjust these statistics to account for the time that the opponent has the ball. For example, Player A who averages 5 clearances per game might be better than Player B who averages 6 clearances if Player A's opposition had the ball 20% less often. That would mean player A made more clearances given the opportunities provided to him. So I will adjust all metrics by opposition possession.

Since I am trying to assess what goals are not scored, I going to look at the numbers at the team level first. It is only at the team level that goals can be attributed. After that analysis I will attempt to attribute value to the individual metrics.

sources: whoscored, mlssoccer.com

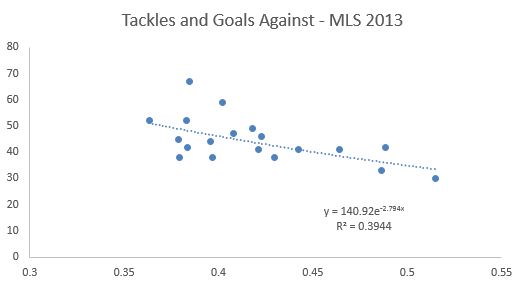
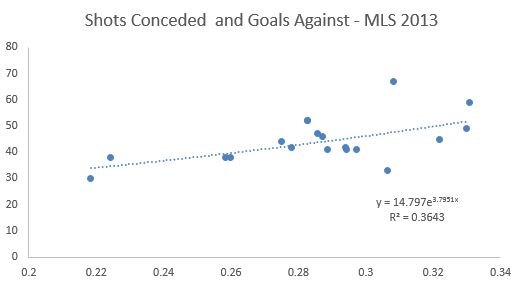
Here are tackles per game per minute of opponent possession against goals scored. Tackles represents the strongest correlation of all the variables. In fact, tackles has a slightly stronger correlation to goals against than shots conceded. Here is a look at the shots conceded as a percent of opponent minute of possession.

sources: whoscored.com, mlssoccer.com

The two points to the far left represent the LA Galaxy and Sporting Kansas City. They appear adept at limiting shots on goal per minute of opposition possession. They also stand out when looking at offsides won.

Rather than show every graph, here is a table of the defensive statistics, their level of impact and the R squared of the impact in predicting goals against.

Statistic

Goals Avoided per Unit

R squared

Clearances

-0.041

27.1%

Interceptions

-0.036

15.1%

Tackles

-0.077

39.4%

Offsides Won

-0.113

16.0%

Blocks % of Shots

-0.017

0.3%

Offsides won is the most impactful of the statistics (has the greatest slope) but there is a weaker correlation than Tackles or Clearances--in other words, there are greater deviations from the trend line. It's interesting to see that Blocks as a percent of shots has almost no impact on goals allowed.

This is interesting, but what to make of it all? In an ideal world we could compile these statistics into a meaningful metric in order to compare players. The most obvious way to do that statistically would be to run a multivariate regression using all of the statistics.  The trouble with the result is that the statistics end up not being statistically significant predictors when mashed together. So developing a score from these metrics would be a bit of a fool's errand.

The other option would be to ignore the predictive strength of the variables and just use the goals avoided results as a scalar, multiply them by each player's statistics, add them up and compile a score. In this case the resulting score would be something we relate to as we could say that this player avoids x number of goals per game. However, this would give offsides won the statistic with the greatest importance despite the fact that the correlation is not strong.

To factor in the correlation we could leave the realm of sound statistical practice. We could multiply the goals avoided scalar by the R square. We could turn that into an index with the highest metric (tackles) equaling 1. If we did that here is the resulting table and values for each metric.

Statistic

Goals Avoided per Unit

R squared

GApU x R2

Index

Clearances

-0.041

27.1%

-0.011

0.37

Interceptions

-0.036

15.1%

-0.005

0.18

Tackles

-0.077

39.4%

-0.030

1.00

Offsides Won

-0.113

16.0%

-0.018

0.60

Blocks % of Shots

-0.017

0.3%

0.000

0.00

Tackles would be the most important statistic followed by offsides won and then clearances and interceptions. It turns out blocked shots have no material value in estimating goals against.

Before I use these numbers to reveal the top 10 MLS defenders, here are the caveats. Obviously this ranking is missing a few vital elements of defending in soccer. The first major omission is positioning. Often a defender being in the right position forces an offense to not make a pass that would increase their chance of scoring. There is no measurement for that but obviously a defender out of position is not a valuable defender. Clearances, interceptions, tackles and offsides won are clearing indicators that the player was probably in position to make the play and they indicate the player succeeding making the necessary play. But offensive attempts avoided are clearly missing.

The other major omission is the offensive play of the defender. A defender who defends well and represents an offensive threat is that much more valuable. But I'm not trying to solve for that here. I leave that for the subject of another post to integrate passing and offensive numbers to build a better score for defenders.

Here are the top 10 MLS defenders based on the score developed through the last week for players with a minimum of four appearances.

Rank

Name

Team

Tackles

Intercepts

Off Won

Clears

Defender Score

1

José Gonçalves

New England Rev.

1.6

2.4

2

11.2

7.376

2

Giancarlo Gonzalez

Columbus Crew

2.1

2.9

1.9

9.3

7.203

3

Norberto Paparatto

Portland Timbers

1.8

4.8

1.3

9.3

6.885

4

Carlos Bocanegra

CD Chivas USA

1.5

3.6

2.1

8.9

6.701

5

Andrew Farrell

New England Rev.

2.9

2.4

0.3

8.3

6.583

6

Jamison Olave

New York Red Bulls

1.9

3.1

1.7

6.7

5.957

7

Victor Bernardez

San Jose Quakes

1.5

2.8

0.7

9.5

5.939

8

Matt Hedges

FC Dallas

1.5

3.9

0.9

8.5

5.887

9

Eric Avila

CD Chivas USA

4

2.4

0.8

2.3

5.763

10

Chris Schuler

Real Salt Lake

1.8

2.8

0.5

8.3

5.675

I find it comforting that, for a new metric, Jose' Goncalves, MLS Defender of the Year in 2013, tops the list. There's a big drop between the top 2 defenders and Paparatto. There's also another cliff after Andrew Farrell. But hey, it's a start.

I hope this was an enlightening ride through the mechanics of defending from a soccer perspective. The next time you're watching a game, don't just focus on the breakdowns. Also look for what makes the defense successful.

Passing: An oddity in how it's measured in Soccer (Part I)

In my passion to better understand how soccer is statistically tracked I've come across what I would call is an oddity about the general characterization of "passing" in the world’s greatest sport. Here's the deal - go to Squawka.com, whoscored.com, reference the "Stats" tab on mlssoccer.com, or review Golazo information, and you'll notice they all provide passing information.

My intent is not to dig deep into passing details – not yet, anyway. We’ll get there in another article to follow after I get permission from OPTA to reference their F-24 definitions within their Appendices. For now here's a simple question I have as a statistical person working on soccer analysis.

What is the number of passes I should use for teams and which denominator is the right number for total passes by both teams to help determine possession percentages?

In the MLS Chalkboard you can clearly see and count passes - here's an example from a game this past week.

An important filter to note - the major term 'Distribution' is not to be clicked in creating this filter - all that is clicked is 'successful pass and unsuccessful pass'; note also that some details are provided on the types of passes  - we’ll get there in another article.

Bottom line is that the MLS Chalkboard identifies 309 successful passes and 125 unsuccessful passes for a total of 434 passes attempted.

On the MLS Stat sheet - one tab over but linked here the number of passes for Chivas = 369; that number doesn't match the Chalkboard in either total, unsuccessful or successful.

For Golazo, for that same game here's their total: 369 Passes total with 75% accuracy meaning the total successful passes was 277 and unsuccessful passes totaled 92.  Not the same either.

For Squawka.com here's their total: Successful = 270 /// headers (8), throughballs (2), passes (239), long balls (21) and supposedly crosses (0) Unsuccessful = 86 /// passes (52), headers (14), long balls (20), no unsuccessful crosses or throughballs logged here?! Yet the MLS chalkboard indicates 26 unsuccessful crosses! All told that is 356 passes; those figures don't match the other data sources.

For whoscored.com here's their total: Short ball = 323, Long ball = 52, Through ball = 2, Cross = 35, for a total of 412 passes - again that figure doesn't match the other data sources.

So what's the right total?  Here’s a table to compare showing the source of data and the total passes submitted for statistical folks like us to leverage in our analysis.

MLS Chalkboard 434
MLS Statistics 369
Golazo (same as MLS Stats) 369
Squawka 356
Whoscored 412

Observations:

I have no idea what 'right' looks like here but here's what I've done to work through this issue.

I chose one source, the MLS Chalkboard, to gather and analyze statistics on passing and possession and all other things available from that data source - where other information is not offered there I reference the MLS Stats tab and Formation tab.

Why did I choose the Chalkboard?  Because it provides additional detail that shows more clarity on all the other types of passes that occur in a game.

For example; if you scroll down on the Chalkboard link and select Set-Pieces you’ll see that Throw-ins are included in the successful passing totals – by definition a Throw-in is a pass as it travels from one player to another.

So my recommendation, if interested, is to track Major League Soccer statistics using the MLS Chalkboard first - it's harder but seems to be the best one at this time.

I'm not sure why the MLS Chalkboard, Golazo, Whoscored and Squawka all had different team passing statistics; given that it is likely they all have different individual player statistics as well... but in asking a representative from OPTA about that - their response was provided below:

“The difference between the different websites could be down to a few things. Either they take different levels of data from us, or they take the same feed but only use a chosen set of information from each feed to display their own take on each game.”

By the way – I did try to find a reasonable definition of what a pass is defined as for soccer; here’s some of that information before final thoughts… note: they are all different and Wikipedia proves, by its definition, why it’s a pretty useless source for information…  for them a pass in soccer must travel on the ground – no kidding – here’s their definition up front:

“Passing the ball is a key part of association football. The purpose of passing is to keep possession of the ball by maneuvering it on the ground between different players and to advance it up the playing field.”

Other definitions get pretty detailed – it is what it is apparently – complicated…

Passing Definition: About.com World Soccer.

When the player in possession kicks the ball to a teammate. Passes can be long or short but must remain within the field of play.

Soccer Dictionary: Note there are numerous definitions provided in this link so offering up a specific link is troublesome so I will cut and paste those definitions below:

Cross, diagonal: Usually applied in the attacking third of the field to a pass played well infield from the touch-line and diagonally forward from right to left or left to right. Cross, far-post: A pass made to the area, usually beyond the post, farthest from the point from which the ball was kicked. Cross, flank (wing): A pass made from near to a touch-line, in the attacking third of the field, to an area near to the goal. Cross, headers: 64% of all goals from crosses are scored by headers. Cross, mid-goal: A pass made to the area directly in front of the goal and some six to twelve yards from the goal-line. Pass, chip: A pass made by a stabbing action of the kicking foot to the bottom part of the ball to achieve a steep trajectory and vicious back spin on the ball. Pass, flick: A pass made by an outward rotation of the kicking foot, contact on the ball being made with the outside of the foot. Pass, half-volley: A pass made by the kicking foot making contact with the ball at the moment the ball touches the ground. Pass, push: A pass made with the inside of the kicking foot. Pass, sweve: A pass made by imparting spin to the ball, thereby causing it to swerve from either right to left or left to right. Which way the ball swerves depends on whether contact with the ball is made with the outside or the inside of the kicking foot. Pass, volley: A pass made before the ball touches the ground. Passing: When a player kicks the ball to his teammate. Through pass: A pass sent to a teammate to get him/her the ball behind his defender; used to penetrate a line of defenders. This pass has to be made with perfect pace and accuracy so it beats the defense and allows attackers to collect it before the goalkeeper.

Ducksters.com offers up a Glossary and Terms for Soccer; here’s what they define a pass as being…  this one is geared more towards teaching players about various types of passes they will need good skill in order to execute them.

Direct Passes - The first type of soccer pass you learn is the direct pass. This is when you pass the ball directly to a teammate. A strong firm pass directly at the player's feet is best. You want to make it easy for your teammate to handle, but not take too long to get there.

Passes to Open Spaces - Passing into space is an important concept in making passes in soccer. This is when you pass the ball to an area where a teammate is running. You must anticipate both the direction and speed of your teammate as well as the opponents. Good communication and practice is key to good passes into space.

Wall Passes (One-Twos) - Now we are getting into more complex passing. You can think of a wall pass as bouncing a ball off of a wall to yourself. Except in this case the wall is a teammate. In wall pass you pass the ball to a teammate who immediately passes the ball back to you into open space. This helps to keep the defense off balance. This is a difficult maneuver and takes a lot of practice, but the results will make it worth the effort.

Long Passes - Sometimes you will have the opportunity to get the ball up the field quickly to an open teammate. A long pass can be used. On a long pass you kick the ball differently than with other shorter passes. You use an instep kick where you kick the soccer ball with your instep or on the shoelaces. To do this you plant your non-kicking foot a few inches from the ball. Then, with your kicking leg swinging back and bending at the knee, snap your foot forward with your toe pointed down and kick the ball with the instep of your foot.

Backward Pass - Sometimes you will need to pass the ball backward. This is done all the time in professional soccer. There is nothing wrong with passing the ball back in order to get your offense set up and maintain control of the ball.

Now that's probably not 'every' definition available but they pretty much say the same thing apart from ‘on-the-ground’ by Wikipedia – a pass is a transfer of the ball from one player to another…

In closing… 

As noted earlier – I’m not really sure what right looks like but I remain convinced that all these organizations are well-intentioned in offering up free statistics for others to use, be it for analysis, fantasy league or simply to check it out.

In my own effort to develop more comprehensive measurements and indicators a standardized source of data for the MLS would be beneficial – if the intent for MLS is to endorse OPTA then there remains a conflict as Golazo clearly does not use the same data filters as the Chalkboard.

My vote, is and will remain, keep the Chalkboard and then, MLS, consider ways, as OPTA (Perform Group) is now, to improve it for more beneficial analysis.

Here is Part II  - where I peel back a wee bit more - consider these phrases, successful crosses, launches, key passes, through-balls, throw-ins and more, as ASA continues its venture into Soccer Analysis in America.

Here’s a few paraphrased thoughts from other folks who offer up articles on ASA about this issue on passing statistics:

Jared Young – The massive difference in pass data between sites is troubling and disturbing;   I’ve been primarily using whoscored.com and golazo for my numbers so I may have to explore other options.

Cris Pannullo – Major League Soccer should take an initiative and define what pass means in their league; it is surprising that they haven’t given how popular things like fantasy sports are; people eat statistics up in this country.

All the best, Chris

You can follow me on twitter @chrisgluckpwp

Possession Confusion

Consider every conversation ever had about soccer tactics. I would bet 99.9% of them touched on one specific subject: possession. Whether it’s the men’s league team you play for, or the club team you cheer for, isn’t more possession always a good thing? I can’t answer that question confidently, but I will explore it. The first obstacle to analyzing and discussing possession in MLS is the data itself. We get our data from Opta, and this is what Opta defines as possession:

During the game, the passes for each team are totaled up, and then each team's total is divided by the game total to produce a percentage figure which shows the percentage of the game that each team has accrued in possession of the ball.

“Possession” in Opta’s data is thus a measure of the proportion of completed passes in a match for each team, not a proportion of time. A lot of short, quick passes will accrue possession for a team that may only have the ball for a matter of seconds. This isn’t necessarily bad or good. It is what it is, and we’ll work with it.

Not all passes are created equally---or better put, not all teams' passes average out to be equally effective---but for a moment let’s suppose that they are. It’s hard to gather data on the value of each pass, and hard to then weight teams’ passes accordingly. So let’s just stick with the assumption that all teams' passes are equally effective. Perhaps someday we can sit around drinking beer and punching holes in that assumption. Today is not that day.

Under that assumption of equal passes, a team that completes a higher proportion of passes than its opponent will likely have strung together effective buildup more often than its opponent. Having created more effective build up, that team will likely have earned more scoring opportunities than its opponent. Having earned more scoring opportunities than its opponent, that team will be more likely to score goals and nab points. So this sort of possession should really imply sunshine and rainbows for the participating team. Seems like fair logic to me, but of course, I’m the one writing.

Looking at the tables—tables that were created with Opta’s version of possession, remember—we don’t see a strong correlation between possession and results. Four of the top five teams (by points per match) have 50% possession or less, but overall there is still a weakly positive correlation. We start to get significant results when we assess the correlations between teams’ possession and Attempt Ratios (0.60*), and again with Shots on Goal Ratios (0.55*). Those positive correlations imply that more possession coincides with more scoring chances. Of course, there is not nececelery a causal link.

Let’s take a look at this from another perspective. If we look at the relationships game-by-game—rather than team-by-team—the correlation between possession and scoring chances is still positive. The team that possesses the ball for a majority of passes (Opta’s definition) during any given match also tends to earn more scoring attempts than its opponent.

So far I’ve bored you with support for conventional wisdom: possession coincides with more scoring opportunities, and thus probably with better results.

But then I control for a few variables and shit goes haywire.

When I control for each individual team and whether or not they were playing at home, the relationship between possession and results is decidedly negative. In fact, a team that possesses the ball an additional 10% in any given match is expected to lose half of a goal on average, equivalent to about half of a point. For example’s sake, consider the Seattle Flounders Sounders. Over Seattle’s top four matches in terms of possession, it has earned just one point. However, during Seattle’s bottom four matches in terms of possession, it has earned eight points. Seattle is an extreme case, but a good example of what my model is picking up. Most teams individually seem to do worse when their possession is higher.

So more possession seems to correlate with more shots, and more shots seems to correlate with more goals, but for some reason more possession does not share a significant relationship with more goals. There is some missing information screwing with me, and I don’t have a definitive explanation for this strange paradox, but I will share a theory.

Each team has a style. Whether or not that style works is probably mostly a product of how well the players fit in, and how good those players are in the first place. Perhaps, in general, a style that focuses more on stringing short passes together tends to produce more shots than a high-risk/high-reward style, but this type of possession is not a necessary condition for success. Once each team develops its style, a certain amount of possession is required to optimize that style. For Montreal, it may be 49% possession, and for Portland, it might be 57%. This would explain the mild positive correlations between possession and shots across teams.

But why is it that, across games, more possession seems to correspond to less goals and worse results?

In a given game, if a team generates more possession—more passing by Opta’s definition—then perhaps that is indicative more of the opponent’s defense than of the desire of the team in question to possess. In other words, an excellent defense may not necessarily kill possession, but rather, push possession to less dangerous parts of the pitch. In this way, more possession is simply indicative of a frustrated team, not a team in control doing what it wants to do.

Without being able to conclude this thought exercise satisfyingly, I will propose a few things. First, that by charting each shot’s point of origin, we can begin to assess the quality of a team’s shots. And second, that possession data should be gathered from the distinct areas on the pitch. Possession in the attacking third is likely more valuable than possession in the defensive third. Some combination of these two measurements could very well help to explain the paradox we’re seeing with passing possession and team success.

*A perfect positive correlation would be 1.0.

Montreal's Paradox

If you have listened to our podcasts or read through our stuff, you will have heard us talk about shot ratios a lot. That's how many shots a team gets divided by how many shots its allows its opponents. A shot ratio of 1.5, for example, means that a team gets one-and-a-half times as many shots as its opponents. When soccer teams create extra opportunities for themselves, it generally leads to more goals and more points in the standings. And then there’s Montreal. The Montreal Impact has been something of a Cinderella story this season, at least statistically. Leading up to its matchup with the Chicago Fire on Saturday, the Impact had recorded the second-worst shot attempt ratio in the entire league. Montreal had earned just 61 shot attempts with 28 on target to its opponents’ 95 shot attempts with 32 on target.  Yet somehow, the Impact had maintained a positive goal differential (+2) and the second-most points per match right behind FC Dallas.

Against Chicago, Montreal not only won on the scoreboard two-nil, it also won the shooting and possession battles. But that is a rare feat this year for the Impact, and it’s worth posing the question: Has Montreal been lucky this season, or does it do things that shot ratios and possession just can’t explain?

Using just shots on goal for now, I regressed goal scoring ratios against shot ratios to see how teams “should do,” as if shots on goal were the only thing that matter. Even this early in the season, the regression was not all that bad (R2 = 0.4). It also said that Montreal’s 0.94 shot ratio should lead to about the same goal ratio.* Well that makes sense. If you generate roughly the same number of shots on target as your opponents, you should score about the same number of goals. The Impact, however, have scored nine goals to its opponents’ five—a 1.8 ratio, or +4 differential, if you prefer.

An obvious thing to consider is finishing rate. Despite being outshot, the Impact players finish their attempts with goals more than twice as efficiently as opponents do. That ratio is the best in the league. My first instinct is that the Impact has been somewhat lucky, and that opponents will start to finish with more frequency. But there are two possible explanations I want to explore first before waving the cliché luck flag: the quality of opportunities for Montreal and the quality of opportunities for its opponents.

Harrison talked a little bit about Montreal’s counter-attacking style during a recent podcast, and there’s a possibility that the Impact’s style allows low-quality opportunities to its opponents, leading to higher-percentage opportunities for itself on the counter attack. (Before we investigate, it should be noted that Montreal’s schedule has featured teams that average out to be, well, league-average when it comes to finishing.)

Let’s take Saturday’s match against the Fire as an example of the tools I’m using. Check out the Opta chalkboard for yourself here, and you can see from where teams are shooting and scoring by clicking the appropriate boxes for team and statistic of interest. During this particular game, I have Montreal down for 16 scoring attempts, nine from outside the box, six inside, and one from right on the edge. Both its goals were scored from inside the box (though you could argue one was one the edge). Chicago, on the other hand, earned 11 attempts, ripping seven of those from outside the box, just two from inside, and two from the edge of the box. Chicago did not score. I did this for each of Montreal's seven games this season.

Obviously things like angle matter, too, but I’m not going to pull out my protractor for this one. Here’s the breakdown for Montreal and its opponents on the season:

Attempts Goals Finishing
Stat Montreal Opponents Montreal Opponents Montreal Opponents
Inside Box

40

45

6

4

15.0%

8.9%

Outside Box

31

56

3

1

9.7%

1.8%

On Edge

6

5

0

0

0.0%

0.0%

Total

77

106

9

5

11.7%

4.7%


Montreal earns more shots inside the box than outside, and that might very well be a product of its system and players, rather than just dumb luck. While the Impact is being outshot in total, perhaps that stat is skewed slightly by shot selection. Montreal's system seems to create a greater proportion of opportunities in the box. I would still expect some regression from Montreal this season back toward the middle of the standings—as its shot ratios are not favorable even after adjusting for quality—but perhaps not as far as a simple shot model would suggest.

*One might note that Montreal’s attempts ratio is quite a bit worse than its shots-on-goal ratio, which isn’t even that good to begin with. It is apparently too early in the season for attempts ratios to explain much of anything with certainty, but shots models from past seasons suggests Montreal’s goal scoring ratio should probably be even worse than even-ish. That is, if shots aren't broken down by quality.

Big and Small Data

We talk and we talk about the need for more information to solve some of the problems and general questions that we have as a collective community within Soccer Analytics. Today I ran across a general post about Big Data, and the revolution of really small data. It led me back to thinking about some of the discussions that Matthias (apparently he has a real name), Keith (the missing guy in the podcasts), and I have had outside of the podcasting realms. It's not always about waiting to develop thoughts or theories until you have data, but making do with what you have at your current disposal and developing theories that later--with further advances--you can prove or disprove.

Just as we now find it ludicrous to talk of "big software" – as if size in itself were a measure of value – we should, and will one day, find it equally odd to talk of "big data". Size in itself doesn't matter – what matters is having the data, of whatever size, that helps us solve a problem or address the question we have.  - Rufus Pollock

I'm not saying that anyone is or is not doing this... it just seemed really profound after a cup a coffee and two shots of espresso, so I thought I'd mention it.

Opta loosens the chains a bit

opta

Look, it's late, you'll have to forgive the hack job JPEG above. I have no idea why I'm up besides the fact that I don't have to go to work in the morning. But with the upswing of free time, I'm just perusing the internet and generally reviewing information that I often don't find time to cruise through. While sifting through data and spending my time nodding off to sleep at my keyboard, I came across Opta's playground site where they are "opening up the database."

I'm not sure how new this is or if it is just something I missed. But I know it wasn't available the last time I was around. It's a basic request for people nerds like me (and possibly you...) to submit data requests.

An understatement would be to call this development "cool."

A lot of data within Soccer is closed off and generally leaves a lot to be desired. Being a guy that used to write a lot about baseball, it would be awful--strictly speaking from my perspective--to write about a player if the lack of overall information that was provide is akin to that of modern day soccer data.

It's safeguarded and looked after as if it was top secret defense information. To be fair, I actually think that some of that information is kept more secure than defense information. But that's not really the subject. Having the ability to submit an e-mail request for specific data is exciting. It's a marked improved over the current status quo.

Sure, you could complain about the fact that they only accept one application in all categories per email address, but who cares? It's an improvement, and here at ASA, that's what we're all about. Improvement. And soccer. And beer. So that's not what we're all about. But it's part of what we're about.