How it Happened: Week One

Hello friends. This is the first in what will hopefully be a weekly feature here at ASA by yours truly. First, the background: Not being a fan of any particular MLS team is hard. It's hard to follow an entire league of 19 teams. Seven or eight games a week are difficult to catch up on, even when they aren't all played at the same time. Previously, I've watched highlights and 'condensed games' to try to pick up which teams and players were playing well, but it just doesn't work. The only way to really learn a team's strengths, weaknesses and tendencies is by watching every minute of every game they play. There's no way I can do that with every team in MLS while still working a full-time job. Sorry.

My solution is this: I plan on committing to watching a full 90 minutes of three games per week. This gives me six teams that I'll feel that I truly know (at least for that week), and should certainly teach me a heckuva lot more than just if I just watched their highlight packages. Since this here is an analytical and statistic-focused blog, I'll break down each of the three games by one particular stat or Opta chalkboard image that I think told the story of the game for each team. Think this idea is idiotic? Love it? Please, let me know: feedback is always appreciated. But leave my mom out of this.

DC United vs. Columbus Crew

Stat that told the story for Columbus: 58% of successful passes in attacking half for the fullbacks

clb1

The above image is all of the completed passes for Crew fullbacks Waylon Francis and Josh Williams on Saturday. These two players are clearly defenders who aren't afraid to get forward, but the startling frequency with which they were able to get up the field against DC had to have alarm bells ringing for United fans. For folks who prefer numbers to images, here you are: 49 of the 85 passes that Francis and Williams completed (58%) were in the attacking half. That's a pretty solid attacking contribution from two guys who are listed along the back line.

This was made possible for Columbus by a couple of adjustments made by new coach Gregg Berhalter. Centerbacks Michael Parkhurst and Giancarlo Gonzalez split reallllly wide when in possession, allowing both fullbacks to get forward. This was made possible by holding midfielder Wil Trapp, who sat very deep to cover the gap between centerbacks. It's only one game, but it certainly looked like a good strategy in week one for Columbus.

Stat that told the story for DC: 1 attacking player's pass into the penalty area

dcu1

Really, the above image for Columbus tells a lot of the story for DC, as well: they got hammered because the Crew got the ball wide and stretched DC's shape like a bad hamstring. With a team full of new faces who clearly haven't learned to play with one another yet, the defense was abused by all the space Crew players were able to find. But I can't use the same stat for both teams, so here's what I got for United: one. One successful pass from any of the three players nominally deployed in attack (Eddie Johnson, Fabian Espindola, Luis Silva) that ended in the penalty box.

Seriously: take a look at the Opta Chalkboard above. I get that it's hard to complete passes in the 18, but for the three guys who are tasked with creating chances, there needs to be more than one completed pass that ends up there. Oh, and that one completed pass? It came from a free kick, and ended with a flick-on by Davy Arnaud that didn't even turn into a shot. There was a lot wrong with DC in 2013 and a lot wrong with DC last weekend, but if the new faces of Johnson and Espindola were expected to cure all attacking ills....Ben Olsen may be in for a rude awakening.

Portland Timbers vs. Philadelphia Union

Stat that told the story for Portland: 20 crosses in the second hour of the game

The Timbers came out for the season opener and were dealt a dose of their own medicine from the new-look Philadelphia Union. Playing in a 4-3-3, the Union clogged the center of the field, put a lot of pressure on Portland and really made it difficult for the home team to get into their possession game. But as any good team does, the Timbers made adjustments. After being credited with just two crosses from open play in the games first 35 minutes, Portland emphasized wide play with Michael Harrington getting forward and Darlington Nagbe flaring out wide. After the 35th minute, Opta credited Portland with 20 crosses from open play. Some of this was due to bombing the ball forward as they sought an equalizer late, but recording 10 times as many crosses was certainly the product of an adjustment made by the Timbers.

Stat that told the story for Philadelphia: 12 midfield interceptions & recoveries to start the game

As I said above, the Union started the game very strong, with their midfield really clogging up Portland's attempts to possess the ball. The midfield three of Maurice Edu, Brian Carroll and Vincent Nogueira seemed to be replicating some of what made Portland so successful in 2013: clogging the middle of the field and winning a majority of loose balls. Opta credits those three with 12 combined interceptions and recoveries in the game's first 22 minutes. However, as also noted above, Portland adjusted to the Union's set-up and began to emphasize wide play. The Union didn't really adjust to the adjustment, as the Timbers clearly became more and more comfortable as the game went on. After those 12 interceptions/recoveries in the first 22 minutes, Edu, Carroll and Nogueria only recorded seven more the rest of the game.

LA Galaxy vs. Real Salt Lake

Stat that told the story for LA: 2.39 expected goals; 0 actual goals

lag1

If you're at this site, chances are you know the concept behind expected goals. If not, scroll down a ways and read up. Anyway, look at the above image: that's not a map of shots that typically leads to a shutout. According to the numbers run by ASA's own Harrison Crow, a league average team would've finished 2.39 goals from those shots. They finished zero. If you aren't into the stats and would prefer the English commentator's version: Robbie Keane missed some sitters, Landon Donovan was unlucky not to finish any of his half-chances, and Juninho and Marcelo Sarvas combined for some speculative efforts that nearly bulged the ol' onion bag. Oh, and Nick Rimando had a magisterial day in net to keep his clean sheet.

Stat that told the story for RSL: Joao Plata's complete game

I'm cheating a little here because that's not a real stat, but any time there's a 1-0 game, it's tough to leave out any conversation about the lone goal scorer. In this case, that's the diminutive Ecuadorian, Joao Plata. Plata debuted for Toronto FC three seasons ago, and it seems like he's been around for a lot longer than your average 22-year-old. But it's true. Plata is only 22, and if Saturday night is any indication, he could be in for his best season in MLS yet. Not only was Plata's finish on the game's only goal very cool, he was consistently playing with a lot more tactical awareness than I've seen out of him in the past. Whether it was setting up Alvaro Saborio for golden chances or making intelligent runs to stretch the defense and open up space for Javier Morales, Plata had a very, very good game against LA.

MLS Possession with Purpose Week 1: The best (and worst) performances

Greetings one and all as the new season begins in MLS. In case you missed it I published an article on here not to long ago that dives into my Possession with Purpose Indices to include a general introduction on what it is and means as well as some explanations behind the Indices. If you haven't gone through the article before or if you need a refresh click here.

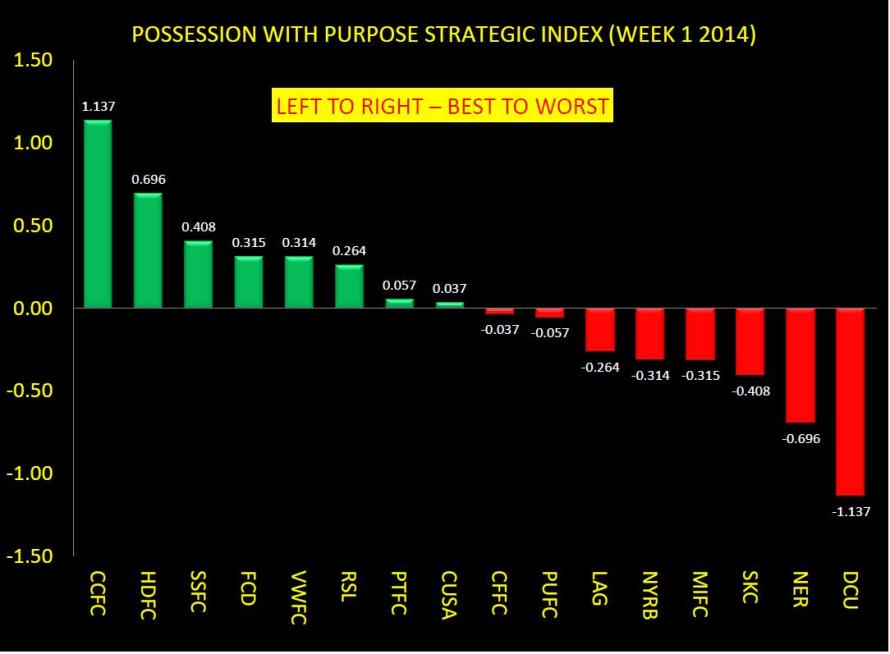
Here's how the teams fared, compared to each other, in Possession with Purpose Week #1:

POSSESSION WITH PURPOSE STRATEGIC COMPOSITE INDEX WEEK 1 RESULTS

Observations:

This Index is not influenced by previous season results; it's a new year and a fresh/clean slate for teams to build from as they all challenge each other to make the Playoffs. So all you supporters of teams that didn't do so well this past year - fahgetaboutit!

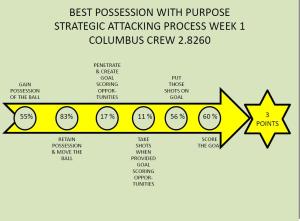
Next thing to consider is that positive numbers indicate the team performed better in attack and defense than their opponent - in looking at the diagram note that Columbus is at the far left while their opponent is on the far right.  As the season unfolds these overall positions should change.  As noted Columbus had the best overall attack compared to all other teams this past week; here are their percentages in the six steps of PWP:

BEST PWP RESULTS FOR WEEK 1 IN MLS - COLUMBUS CREW

Another top performer was Houston - some consider, last year, they were a sleeping giant that simply didn't wake up in time for a solid Playoff run - I do - in their first game this year they burst the flood gates with 4 goals and some solid and superb defense led by a guy I absolutely hated to see leave Portland - David Horst.

Some may gaffaw at this but this time last year - before his injury - I thought David had a superb chance to get a wee bit stuck in (some minutes) on some USMNT training like Michael Harrington did this off-season.

I still think David has great pedigree as a stand-up defender with great timing and good vision to see gaps and create gaps. So if you are a Houston supporter know that I have a special interest in seeing David do great things.

As for reading the diagram - there's a note there to read it from left to right (best to worst). The composite Index is the difference between the team Attacking PWP Index and the team Defending PWP Index. The overall total represents the ratios of success each team had in performing the six basic steps, possession, passing accuracy, penetration, creation, targeting, and scoring a goal. It's not perfect but last year it was very representative.

Before getting to the other PWP Indices...

This is the first week and like most things that are measured, to begin with, there may be wide variation in the first 10 or so samples analyzed - so like last year Chivas began with a good start.

Does that continue or do we see them tail off - likewise - DC United ended the season near bottom in almost every single PWP category - so far they are right where they left off. Will time show that Eddie Johnson was a good purchase - we'll see.

As for the leaders from last year like Real Salt Lake, Sporting KC and Portland. It's no secret now that RSL opened up with a solid three points away to LA Galaxy - is it rude to expect that Robbie Keane will miss another penalty shot this year?

How about that torrential downpour in Portland - rain is not unusual for that part of the country - does it rain a bit more on the Timbers this season or will the sun begin to shine as Fernandez, Valeri, Nagbe, Urutti and others really get there gears engaged with what many feel and think might be the most potent attacking system/scheme/player personnel package in the league?

In considering what Sporting KC has on their plate early in the season, 5 games in the course of 15 days I think - is it too much to expect that they will show early indication of dominance again?

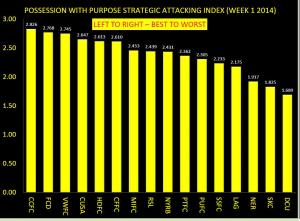
In looking at the PWP Attacking Index here's how those teams rated:

PWP STRATEGIC ATTACKING INDEX WEEK 1 2014

Observations:

It's no secret that goals scored will heavily influence the outcome of a game - that's to be expected - so those teams that scored a brace or more of goals this early in the season will rate higher than some that didn't score as many goals.

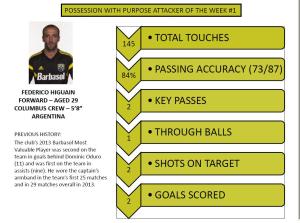
Another new feature this year will be a PWP Attacking and Defending Player of the Week - where some key individual statistics are highlighted that helped influence overall team performance.

For this past week the PWP Attacking Player of the Week is Federico Higuain.

PWP ATTACKER OF THE WEEK #1 2014

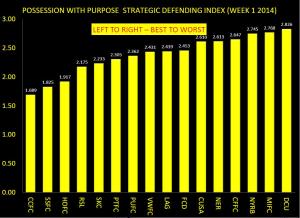
In looking at the PWP Defending Index here's how the teams fared:

PWP STRATEGIC DEFENDING INDEX WEEK 1 2014

Observations:

Since this is the first week the top defending team also happens to be the top attacking team.

For each specific week (not cummulative) this will be the case - for me there is nothing wrong with that - it takes a solid defense to win games as well.

At the end of the season there might be a pattern on who's the top performer, week to week, that is influencing the outcomes of team performances better than others; we'll see.

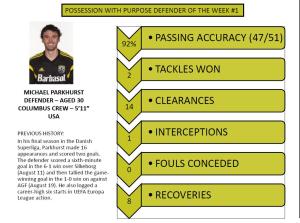
For this past week the PWP Defending Player of the Week is Michael Parkhurst.

PWP DEFENDER OF THE WEEK #1 2014

In closing...

As the season progresses (right around week 15 or so) I'd offer that the PWP Strategic Composite Index should help paint a picture/expectation on what teams are working towards making the Playoffs and what teams are the doormats.

By week 17 last year this Index had accurately predicted 8 of the top 10 teams to make the Playoffs and by seasons end this Index had offered up 9 of the top 10 teams to make the MLS Playoffs; exceeding, in accuracy/prediction both the Squawka.com and Whoscored.com Indices - hopefully that level of predictability shows up again this year.

A couple of housekeeping things - my first and foremost source for data remains, like last year, the MLS Chalkboard developed and provided by Opta. Second - as the year continues I will attempt to peel back some more detail on 'defending' by teams in the final third.

Not sure how that will go but know that in a few weeks time I should be able to offer some additional team defending performance indicators for all MLS teams...

All the best, Chris

DC United Score Alain Rochart On The Cheap

Today, the Vancouver Whitecaps traded defender Alain Rochart, their starting left back, to DC United for a second-round selection in the 2015 MLS SuperDraft as well as an conditional pick in 2016. Vancouver gets a rough lottery ticket, a little bit of freed up cash and the United get a veteran defensive back.  It's not specified if Vancouver will still be on the hook for Rochart's salary, but considering the lack of return, for the basis of this work I'm going to assume that to be the case. The trade on the peripherals seems rather odd and strikes a few questions in my mind as to why this move was even made and what EXACTLY did each team acquire.

Looking at the Swede, Alain Rochat, DC United obviously get a guy who is average positionally in the league. He's not brilliant by any stretch of the imagination, but he's not bad at what he does. He's going to give you minutes; he's given the Whitecaps back-to-back seasons of nearly 2,500 minutes. While being able to provide minutes is great, the larger issue is the quality of those minutes. How does he compare to the rest of the league?

According to the site Whoscored.com they have him listed as the 9th best starting left back in MLS and is the 8th highest paid. So over all the price tag pretty much suits what  he costs, though the average cost of an outside back is roughly $100k.

Point Total Team Name WhoScored Rating Minutes Wage
24 RSL Chris Wingert 7.12 508 $160,000.00
11 Chicago Gonzalo Segares 7.09 990 $155,000.00
20 LA Todd Dunivant 7.12 608 $150,000.00
22 Portland Michael Harrington 7 1159 $140,000.00
18 Seattle Leo Gonzalez 7.47 882 $135,000.00
15 San Jose Justin Morrow 6.8 1174 $130,000.00
25 New York Roy Miller 7.07 877 $124,000.00
16 Vancouver Alain Rochat 7.02 969 $120,000.00
11 Chivas Wálter Vílchez 6.64 340 $117,000.00
22 Houston Cory Ashe 6.91 1215 $101,000.00
5 DC United Daniel Woolard 6.72 719 $100,000.00
22 Kansas City Seth Sinovic 7.13 1270 $90,000.00
28 Dallas Jair Benitez 6.83 1106 $90,000.00
19 New England Chris Tierney 6.93 658 $82,000.00
26 Montreal Jeb Brovsky 7.11 990 $80,000.00
14 Columbus Tyson Wahl 6.88 1165 $76,000.00
8 Toronto Ashtone Morgan 6.2 469 $60,000.00
8 Toronto Logan Emory 6.7 238 $48,000.00
22 Philadelphia Raymon Gaddis 6.88 1339 $47,000.00
20 Colorado Chris Klute 7.42 956 $46,000.00

Interestingly enough, Rochart matches up pretty well with Portland Timbers left back Michael Harrington, who costs just a nudge more and is rated very similarly. Both possess the ball well and deliver smart short passes out of the back while neither are very strong at tackling.

This comparison is interesting simply because the Timbers acquired Harrington from Sporting Kansas City this past off-season. While the details of the deal aren't disclosed to the public, we know that it centered around allocation money and  a guess in the $75K range isn't crazy.

So we can say the going rate for which DC United paid for is roughly $75K in "specialized "cap space. That's on top of the money that is saved from moving the individual. DC United paid a draft pick, potentially two, depending on the circumstances--of which we have no idea. So let's just work with the understanding that they are only giving up a second round pick in two years.

This is a little tricky because of the fact that we don't necessarily know what overall pick DC United will be giving up. While this matters only for the sake of history and being able to create context based upon past experiences, it only minimally limits our understanding of the value of this pick.

In the 2013 Superdraft, a second-round pick's average contract was worth roughly 35K, and that's specifically for a young-ish sort of player that qualifies for the draft. While that potentially could be of some value, you can see players such as Chris Klute, Chris Tierney and Seth Sinovic as great examples, as it could lend itself to assisting to provide some roster flexibility. It's not nearly as lucrative as any type of allocation money.

DC United got a serviceable upgrade and helped solidify a back line that has had a gaping hole in it this past season, while paying nearly nothing for it. On the other hand, the Whitecaps presumably cleared 120,000 dollars off their roster and got a low-risk/medium-reward lottery ticket, and potentially two of them. However, they did this at the cost of downgrading one of their team's strengths.

I can't say that this was a bad move for the Vancouver, but it's an all-too-perplexing one for a team that is only sitting 4 points out of playoff position in the table. Kudos to DC United for making a cheap and smart purchase. At least they did something with their season.