Introducing Shot Locations

On the site and on the podcast we have discussed shot rates an awful lot. A team’s shot rate is simply how many shots it has taken divided by how many shots it has conceded to its opponents. Whenever I make a Game-of the-Week prediction on the podcast, you’ll hear me use two primary pieces of information: which team is at home and which team has recorded the better shot rate. In general, shot rates help to explain not only the relative number of scoring opportunities a team has given itself, but also the relative number of scoring opportunities it is likely to get in the future. It’s predictive. There are, however, some conspicuous outliers in the league—teams that just don’t seem to follow the rules. Harrison wrote earlier this week about Montreal’s shot data. While Montreal gives up far more shots that it earns for itself, Harrison pointed out that Marco Di Vaio and company also place the ball quite well, finding the lower corners a high percentage of the time.

Perhaps Montreal’s own finishing rate is for real. But I won’t be convinced about the low rate at which teams have finished against Montreal before first delving into some new numbers. We have our own shot location data here at American Soccer Analysis, now, and I’m going to use it.
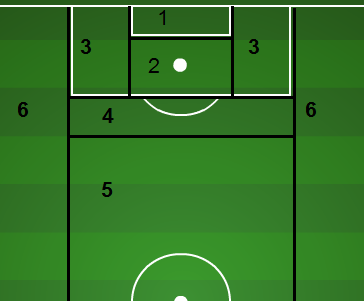
Scoring ZonesI have broken the field down into six primary scoring zones (seen to the right) in the hopes of accounting for the difficulty of both angle and distance.  It is possible that some teams earn a higher quality of opportunities rather than a higher quantity—or vice versa. In addition to recording where each team gets its own shots, I have also gathered the locations of the shots that each team has given up defensively from each zone. Here are some interesting tidbits about Montreal’s defense.

Despite being ahead much of the time—which would seemingly encourage low-quality attempts—Montreal still gives up a league-average proportion of shots from high-scoring zones one and two. In fact, if Montreal’s opponents had finished their attempts from zones one and two at the league average clip, Montreal would have given up six additional goals this season. However, including all six zones, Montreal would have given up just two additional goals due to some unlucky results from distance.

Because Montreal has played a wide range of opponents, it would make sense that its goal scoring rates against would stabilize to something close to league norms. It turns out, for the most part, that those rates have stabilized. The zones help to control for difficulty of shots, and Montreal’s defense isn’t getting particularly lucky based on the shots it is allowing. The major controversy still lies in the Impact’s offense, and whether or not it can sustain a league-leading finishing rate. According to its shot locations, the Impact "should have" scored eight fewer goals this season.

On the flip side we have Sporting Kansas City. Unlike Montreal, the Wiz have dominated the league all season in shot rates, and yet find themselves third in the East in points per match. Could quality of shots be playing a role?

Possibly. Sporting KC gets more shots from zones two and four than the league average team, and those tend to be decent scoring zones. SKC has outscored its opponents by five goals on the season, but with average finishing rates from each zone, one would expect a goal differential closer to +7 or +8. SKC has underachieved by only about two goals according to the shot locations data. How much of that difference is skill versus luck is still well beyond this blogger, but maybe someday...

*Own goals are taken out of the shot locations data.

Montreal Impact And Shot Placement

We like raw numbers around these parts. The lowest common denominator the better. But we like numbers in general, it's as if we are... kind of involved. There isn't much in the way of discrimination. You can take Numbers, and they can tell a story. Numbers can be just as biased as any news reporter or general fan too. They can also help give us insight to a specific question that we may have. A popular question around these parts is simply: why is Montreal so good? A club racing towards an opportunity for Supporting Shield. They sit 4th in the table with 26 points, two points behind the leading FC Dallas and have atleast two games in hand against all clubs above them in the standings. Obviously, they are in very good shape with a chance to run away this season with hardware. So how are they doing it?

Well, the one specific point of contention for us is their shooting. Currently the Impact are 5th in the league in shots on target per match and even further down the pipe at 14th with total shots attempted per match. So the question then becomes, how have they scored 1.69 goals a game, good for best in all of MLS?

They're shooting the lights out. Well, sort of. The ball is ending up in the back of the net at unusually high rates. Matthias and I have pretty much just summed this up to being  an irregularity, an outlier, and one that will eventually see the Impact coming back down to earth.

And yet, they haven't.

Montreal have the highest goal scoring rate in the league, yet have the same goal differential as the New England Revolution that sit 11th in the Supporter Shield table. 6 of their 8 wins have been by won by a single goal margin. Which tell us they've been strong in holding their leads.

It's obviously something that could and likely will involve a much further investigation as time permits. But I did formulate some interesting enough thoughts while digging through Whoscored.com and Squawka data.

Goal Locations

A good 80% of the goals are in high percentage conversation locations on the frame. Predominately low and presumably away from the keeper. You can see that trend continues with their overall shot selection.

shot locations

The majority of their shots are all, again, in great places with one third of the total shots in the lower half of the frame.

I'm not at this point sold that the Impact are going to come back down to earth with their conversion ratio. It's not so much that they are taking shots, but the type of shots they are taking. Marco Di Vaio is 36 and with that comes experience and intelligence.

He understands what he's doing. I believe that his effort to place high percentage shots is not only a skill; it's purposeful, and it's a game plan.

I'm not sure if they can continue to win in their +1 goal states, but their defence* has been very good thus far. It's possible, considering their current form, that they have a legit shot at the Supporter Shield at year's end.

Then again, we just may have to dig deeper into this.**

*Editor's note: Harrison is turning Redcoat on us.

**Editor's note: We will.

ASA Podcast: The One Where Harrison Was Gone

My apologies for the timeliness of the podcast being deployed. At the latest, I usually try to get it up by noon on Sunday. Of course, that didn't happen and you were subjected to my useless apologies that are as common as San Jose yellow cards. Anyway...  I spent the last week out among the gentle Dallas folk spending time with family. It was the last week that my wife's doctor permitted travel out of our local area (ya' know, she's preggers). Since I was out of pocket, Drew and Matthias picked up the responsibility for the podcast and did a great job. They talked US Mens National Team, finally finished up our review of the Eastern Conference standings, added some US Open Cup talk, and closed out the show previewing the Portland Timbers and LA Galaxy match later on this week.

Have a listen:

[audio http://americansocceranalysis.files.wordpress.com/2013/06/asa-episode-9.mp3]

Prediction versus Explanation

There is a subtle, yet very important, distinction between explanation and prediction in most sports, and Major League Soccer is no different. I don’t intend to make this long or particularly math heavy, so hang on. Here’s a simple example of what I’m talking about when I refer to explanation. In its first six games of the season, the Portland Timbers recorded 89 attempts and allowed just 57 to their opponents. During that same time, Portland scored ten goals while allowing eight. I might explain that the Timbers’ +2 goal differential was due—at least in part—to earning more offensive opportunities than their opponents.

Here’s another example, but this time in regards to prediction. In their first six games, the New England Revolution scored two goals while allowing six to its opponents. During its next six games, New England scored eight goals while allowing just three to its opponents. Using just New England as an example, it would seem as though goal scoring in the past (-4) poorly predicted goal scoring in the future (+5).

Of course, we have nineteen teams, not two, so I sorted through all nineteen teams looking for patterns. Here is what I found.

A team’s goal differential during its first six games explained its total points over that same time period extremely well (R2 was 77%). This is not surprising. Teams that tend to score more goals than their opponents also tend to win more games. Nothing shocking there.

However, a team’s goal differential in the first six games of the season provided no help in predicting its total points over the next six games. Here’s the plot on that one:

GD vs. Future Points - 6 weeks 2013

There is virtually no relationship between how well a team scored before, and then how many points it earned later. In other words, goal differentials are not predictive over six games.

But if you’re convinced the lack of predictive ability is completely due to a small sample size of twelve total games, check this out. A team’s attempts differential in its first six games shows a statistically significant correlation to both its future goal differential and points earned:

AD vs. GD and AD vs. Pts


Because it’s sports, prediction is never going to be precise, and these aren't perfect correlations at all. But I find it particularly impressive that over just twelve total games, the attempts data from a team’s first six games shows statistically significant predictive ability of the team’s results in the next six games.

If you’ve listened to our Game-of-the-Week section during our podcasts, you hear us talking a lot about shot ratios. This post hopefully clarified why we do that. Past shot ratios are better than past results at predicting future results.

Squawka Enters MLS Statistic Scene

So last week, ironically at about this exact time, I wrote about WhoScored entering the realm of American soccer and how awesome and exciting it was that they were going to start providing and publishing statistics for MLS---allowing us to skip the process of having to count up all the individual games, not to mention the time-consuming tables that Matty puts together. Now we have much of that information at our convenient disposal. Well we are getting even more spoiled as now Squawka joins the fray of MLS statistics.

If you haven't been to Squawka yet, you need to visit their site. It's not just a great collection of information, it's visually stimulating and helps put things into a context, helping to convey a message better than some writers, especially me, can convey.

This isn't just an awesome thing because it makes mine as well as my associates' lives easier. It's awesome because it's adding to what WhoScored does, not competing with them. This isn't FanGraphs vs. Baseball-Reference where you have similar but altogether different ways of arriving at thoughts and ideas that really confuse the hell out of you---like when you are trying to come up with whether or not Ricky Nolasco had a good season.

Sure there are some subtle differences between the two sites, and even how they end up rating a player. But this isn't about exact sciences at this point. It's more about making data prevalent. A big shout out goes to Nic English and his crew for getting this out there. Job well done.

Fun, or not so fun, Factoid of the Day

While digging through Wikipedia and various articles yesterday, I noticed the following. In 2010, after the expansion draft, DC United traded midfielder Fred Carreiro, allocation money and the #8 pick in the 2010 super draft to Philadelphia in return for goalkeeper, Troy Perkins. That #8 draft pick was used to draft Jack McInerney. Maybe you've heard of him. Keep that in mind when people mention the need for DC to find a goal scorer.

DC United Score Alain Rochart On The Cheap

Today, the Vancouver Whitecaps traded defender Alain Rochart, their starting left back, to DC United for a second-round selection in the 2015 MLS SuperDraft as well as an conditional pick in 2016. Vancouver gets a rough lottery ticket, a little bit of freed up cash and the United get a veteran defensive back.  It's not specified if Vancouver will still be on the hook for Rochart's salary, but considering the lack of return, for the basis of this work I'm going to assume that to be the case. The trade on the peripherals seems rather odd and strikes a few questions in my mind as to why this move was even made and what EXACTLY did each team acquire.

Looking at the Swede, Alain Rochat, DC United obviously get a guy who is average positionally in the league. He's not brilliant by any stretch of the imagination, but he's not bad at what he does. He's going to give you minutes; he's given the Whitecaps back-to-back seasons of nearly 2,500 minutes. While being able to provide minutes is great, the larger issue is the quality of those minutes. How does he compare to the rest of the league?

According to the site Whoscored.com they have him listed as the 9th best starting left back in MLS and is the 8th highest paid. So over all the price tag pretty much suits what  he costs, though the average cost of an outside back is roughly $100k.

Point Total Team Name WhoScored Rating Minutes Wage
24 RSL Chris Wingert 7.12 508 $160,000.00
11 Chicago Gonzalo Segares 7.09 990 $155,000.00
20 LA Todd Dunivant 7.12 608 $150,000.00
22 Portland Michael Harrington 7 1159 $140,000.00
18 Seattle Leo Gonzalez 7.47 882 $135,000.00
15 San Jose Justin Morrow 6.8 1174 $130,000.00
25 New York Roy Miller 7.07 877 $124,000.00
16 Vancouver Alain Rochat 7.02 969 $120,000.00
11 Chivas Wálter Vílchez 6.64 340 $117,000.00
22 Houston Cory Ashe 6.91 1215 $101,000.00
5 DC United Daniel Woolard 6.72 719 $100,000.00
22 Kansas City Seth Sinovic 7.13 1270 $90,000.00
28 Dallas Jair Benitez 6.83 1106 $90,000.00
19 New England Chris Tierney 6.93 658 $82,000.00
26 Montreal Jeb Brovsky 7.11 990 $80,000.00
14 Columbus Tyson Wahl 6.88 1165 $76,000.00
8 Toronto Ashtone Morgan 6.2 469 $60,000.00
8 Toronto Logan Emory 6.7 238 $48,000.00
22 Philadelphia Raymon Gaddis 6.88 1339 $47,000.00
20 Colorado Chris Klute 7.42 956 $46,000.00

Interestingly enough, Rochart matches up pretty well with Portland Timbers left back Michael Harrington, who costs just a nudge more and is rated very similarly. Both possess the ball well and deliver smart short passes out of the back while neither are very strong at tackling.

This comparison is interesting simply because the Timbers acquired Harrington from Sporting Kansas City this past off-season. While the details of the deal aren't disclosed to the public, we know that it centered around allocation money and  a guess in the $75K range isn't crazy.

So we can say the going rate for which DC United paid for is roughly $75K in "specialized "cap space. That's on top of the money that is saved from moving the individual. DC United paid a draft pick, potentially two, depending on the circumstances--of which we have no idea. So let's just work with the understanding that they are only giving up a second round pick in two years.

This is a little tricky because of the fact that we don't necessarily know what overall pick DC United will be giving up. While this matters only for the sake of history and being able to create context based upon past experiences, it only minimally limits our understanding of the value of this pick.

In the 2013 Superdraft, a second-round pick's average contract was worth roughly 35K, and that's specifically for a young-ish sort of player that qualifies for the draft. While that potentially could be of some value, you can see players such as Chris Klute, Chris Tierney and Seth Sinovic as great examples, as it could lend itself to assisting to provide some roster flexibility. It's not nearly as lucrative as any type of allocation money.

DC United got a serviceable upgrade and helped solidify a back line that has had a gaping hole in it this past season, while paying nearly nothing for it. On the other hand, the Whitecaps presumably cleared 120,000 dollars off their roster and got a low-risk/medium-reward lottery ticket, and potentially two of them. However, they did this at the cost of downgrading one of their team's strengths.

I can't say that this was a bad move for the Vancouver, but it's an all-too-perplexing one for a team that is only sitting 4 points out of playoff position in the table. Kudos to DC United for making a cheap and smart purchase. At least they did something with their season.

Game Of The Week Review: Montreal Impact Visit Sporting Kansas City

I know I shouldn't be surprised by the Impact stealing a match on the road, especially considering Sporting's lack of strength at home as of their recent string of outcomes. Though, with all the statistical pointers, it's quiet uncanny that they came up with even a point, let alone all three. SKC-IMP

It's hard to look at the tackles, interceptions and clearances and not think that it's a by product of the Impact largely being on their heels for the majority of the match. That in large part is due to the style which the Montreal Impact implements. The team as a whole has functioned with 48% possession through 12 matches and even less possession (44%) in away games. It's not a bad thing, but it naturally produces more defensive events.

Much of our discussion during the podcasts has dealt with shots and their predictive nature. Montreal has been at the forefront of the discussion, with amazing results despite being outshot on both total attempts at goal (12 to 15 per game) and actual shots on target (4.9 to 5.2) Montreal Impact is currently now sporting 26 points with a goal differential of +7. Not to mention they are boasting the highest conversion rate in the league of 15.3%. Better than the next highest (FC Dallas, 13.9%) by nearly a whole point and a half.

Matthias, Drew and I have discussed whether or not Montreal can continue to maintain such a high finishing rate. It's a legitimate question considering the construct of the situation but, as pointed out by Ravi Ramineni in a discussion this morning on twitter, ‏the problem with making such assertions is that we're looking purely at the shot totals rather than looking at the qualitative state of the shot.

However, while it's interesting enough to question whether or not the Impact are going to stick around and continue to score goals at their current rate, I'm going to leave that for another day. It's even more interesting that Kansas City came up with twice the amount of attempts on goal and the only scored once. That one goal was on a foul that was made right on the line of the 18 yard box. Had the linesman not been on his game, that call could have easily been a free kick.

The question that I really have is more of why was Sporting unable to build upon their chances. Looking at the amount of clearances that the Impact had  I kind of wondered if the fact was that they just couldn't maintain the needed pressure upon Troy Perkins goal.

Kansas City Attempts Name Minutes
FIRST HALF
Miss Joseph Peterson 6'
Attempted blocked Paulo Nagamura 19'
Miss Claudio Bieler 25'
Miss Claudio Bieler 42'
Goal Claudio Bieler 49'
SECOND HALF
Miss Seth Sinovic 49'
Miss Claudio Bieler 56'
Miss Kei Kamara 60'
Attempted Save Benny Feilhaber 65'
Miss Aurélien Collin 69'
Attempted Save Paulo Nagamura 70'
Miss Paulo Nagamura 71'
Attempted blocked Claudio Bieler 76'
Miss C.J.Sapong 78'
Attempted Save Joseph Peterson 82'
Attempted Save Aurélien Collin 85'
Miss Joseph Peterson 90'
Attempted Save Claudio Bieler 92'
Miss Kei Kamara 94'

SKCTimeline

Looking at this you can see three real bunches. First at the 69th-71st minute, Again with the 76th and 78th minute and then in the final moments game a solid run of 90 to 94, ending with Kei Kamra's shot that just drifted wide.

Ultimately, I'm more inclined to believe that Sporting did just as much to not earn a result as the Impact did to really earn one. But while most people would be willing to chalk this game up to luck, I just think it's the largest example of what the Impact do well, and that's disrupting opposing teams while allowing the Impact to sit in their own defensive third. I'm still not inclined, as I'm sure Matty isn't either, to give the Impact the full rights of being a team that is "for real". But they certainly continue to prove their case week in and week out.

ASA Podcast - Episode 8: The One Where Drew is in the Hallway

Welcome, to American Soccer Analysis. After a week off we pick up today with an episode about various soccer events over the course of the past week, Western Conference standings, and our traditional Review/Preview of the LA Galaxy drumming of Seattle, and then tonight's game with Sporting facing off at home against Montreal. All this during an episode in which Drew heads to his hallway in search of a better connection to his internet, when all it really needed was a hug. [audio http://americansocceranalysis.files.wordpress.com/2013/06/asa-episode-8-randomness-western-conference-talk-and-review-preview.mp3]

Finding Numbers: WhoScored And Their Expanding American Statistics

I've stated that one of the goals for this site is the production of numbers, but also generally using them as book markers to bits of information. I haven't been too good about this second part but I'm going to try to get better. One thing that was pointed out to me this last week (h/t Brian Stern) was that WhoScored has at long last increased the information that they provide on MLS. We've had a link to WhoScored for sometime but generally speaking they haven't been very good about keeping the information updated, keeping it accurate or producing anything worth visiting it on a consistent basis. But the fact that they have some basic visuals and do have good content for most of the rest of the world makes it a worthy site. There was also the hope that they would finally find the time to spend on the American-based league.

Well, now they have and it's pretty awesome.

For instance; if I wanted to know who averages the most passes for the San Jose Earthquakes, I could go in real quickly and see that Sam Cronin averages 45.2 passes per game, almost a whole 8 above the trailer Ramiro Corrales (37.9), and that Cronin has completed 475 of 633 passes. The only thing at this point in time that could be better is for it to give a spray chart of where he likes to pass and to whom.

I could see that, according to the stats, Philadelphia has yet to score purely on a counter attack and seems to favor carrying the ball down the right side of the pitch, as they use that side 37% of the time. Alternatively we can see that DC United has taken 65% of its shots from the middle of the pitch. But mostly what it does is it allows us to do is put things in context.

Is it unusual that Houston attempts short passes 80% of the time, or is that normal? Well I can see that DC United and the Columbus Crew make short passes at 78%, but short passes make up 82% of the Montreal Impact's pass attempts. There isn't a wrong or right amount of short passes, but it does help us understand the specific influence of the style and attack.

You may or may not have already seen WhoScored and you may or may not have seen that they updated their American side site. That's cool. This is for those that didn't hear. We're trying to make it easier for people to conduct their own analysis and do so in the most educated way possible.

As a side note it looks like they further plan to expand the information they provide on the US Leagues as they have NASL section dated later on this year, probably anticipated for the second half of their season. That could further help us when attempting to gather information on some of the US Open Cup teams and some of the lesser known players who don't have an opportunity to have their name shine.