Where Goals Come From: Playing the Killer Final Ball
/This is the third article of Season Two and tenth overall article in a series of articles and videos in the Where Goals Come From project from Jamon Moore and Carl Carpenter.
In our last article, we discussed how Expected Goals (xG) helps us evaluate the quality of the shots that a team takes and concedes. That evaluation can happen with individual shots, with a full game, several games (looking at trends), and over the course of a season. As we know from Season One of this series, the type of shot a player gives us a good indication of the typical Goal Conversion Rate (GCR), starting with the very effective shots from Through balls and Cutbacks. We have twelve types of shots in total in our framework, including penalty shots, across five different categories.
However, each Through ball is not a 30% scoring chance. Using Expected Goals as a proxy to Goal Conversion Rate, we can see the chances for a Through ball realistically range from around 5% (0.05 xG) to well over 50% (0.5 xG) with the average around 30% (0.3 xG).
As we know from our first article in Season Two, teams with better Goal Conversion Rates (and also suppress the Goal Conversion Rates of their opponents) win more games and have a better season-long Goal Differential.
We want to make this information actionable for coaches and players. In this article, we’re going to look at the types of Through balls and Cutbacks that provide the best Goal Conversion Rates. We’re also going to make xG more actionable through simple categorization of quality. We’re going to show examples which can be used for film sessions with players.
Tiering Expected Goals
Explaining Expected Goals to players can be very difficult. Providing context to identify actionable improvements is critical and many coaches and analysts don’t know how to do that. We are here to help.
First, we want to divide xG into tiers that will be easy to convey to any audience, but particularly easy to convey to players.
The video below shows how to describe a shot in four “tiers” using Expected Goals: Great, Good, Average, and Poor.
What we want to do is guide players on moving from “poor” shooting situations toward “good” or “great”. The more we can do that, the better our shots’ outcomes are likely to be.
In short, the xG Tiers help us explain shot selection to players in a simplistic way:
Great xG - Improves the average Goal Conversion Rate by 4x or higher
Good xG - Improves the average Goal Conversion Rate by about 2x
Average xG - Provides the average Goal Conversion Rate
Poor xG - Worsens the average Goal Conversion Rate by 2x or more
Identifying the best passes with “Pre-carry” xG
In order to be able to identify the “killer final ball” and the associated best Goal Conversion Rates, we need to use xG to measure the quality of various types of passes and associated shots. However, often shooters improve both by carrying the ball closer to the goal before a shot. That means in order for us to measure the pass quality, we need to measure both the shot xG and also what the xG of the shot would have been if they had immediately shot without carrying the ball closer to the goal.
The shot xG is the final xG value, but we’ll call the location where the shooter receives the pass the “Pre-carry xG”. We can use the Pre-carry xG to help us know which passes are more dangerous. In aggregate, the differences between xG and Pre-carry xG are very small (about 0.01 xG), but some of our shot types, such as Through balls, can get big improvements on Goal Conversion Rates and xG from shooters carrying the ball closer to the goal.
We’re going to now look at the two open play passes that produce the most valuable shots with a slightly modified version of our xG Tiers using Pre-carry xG.
Scoring from a Through Ball pass
Through balls are an excellent way to score goals, but they are infrequent as key pass types go.
Since this is our first shot type profile, let’s explain each of the attributes in the image above:
Conversion Rate without Carry - On a scale of 1 to 5, how good are the conversion rates if the shooter doesn’t carry the ball closer to the goal? 1 - Very Poor, 5 - Excellent
Average xG Improvement from Carry - On a scale of 1 to 5, how much improvement do shooters typically make on the xG of a shot after receiving the ball? 1 - None (one-time shot), 5 - 20% or higher xG improvement.
Key Pass Use Frequency - On a scale of 1 to 5, how often is this key pass used to attempt to create a shot? 1 - Rarely, 5 - Frequently
Conversion Rate as 2nd Key Passes - On a scale of 1 to 5, how good are the Goal Conversion Rates if this pass is used as a Secondary Key Pass? 1 - Very Poor, 5 - Excellent
Dependence on Speed-of-Play - On a scale of 1 to 5, how dependent on speed-of-play is this type of goal? 1 - Not dependent at all, 5 - Very dependent
Disorganizes Defense/Keeper - On a scale of 1 to 5, compared to other types of shots, what is the likelihood that this type of shot will not be able to be blocked by a defender or saved by the goalkeeper? 1 - Very unlikely, 5 - Very likely
Most Popular (Key) Pass Direction - With the opponent’s goal being forward, using an eight-direction circumference (forward, backward, square toward goal, square away from goal, and four diagonal directions), what is the most popular direction that a key pass is made in?
Most Effective (Key) Pass Direction - Same as the previous one but which direction produces the best Goal Conversion Rates? GCR is shown.
Carry Rate After Pass - On a scale of 1 to 5, how often do shooters carry the ball toward goal after receiving this type of pass? 1 - Never/Rarely, 5 - Always/Usually
Lofted or Ground Ball - Up is Lofted, Down is Ground. Which height is more dominant in the creation of goals, and what is the percent use?
If you didn’t watch the earlier video, the bars above represent shots per 0.01 xG, and the highlighted part of each bar represents the number of goals. Notice the highlighted bars are much higher here because shots from through balls are converted at much higher rates than most shots.
Ninety-three percent of shots from Through balls and 96% of its goals are in the Great, Good, or Average xG tiers. Even if not used as the final ball before a shot, a through ball is an excellent way to create another killer ball, with an average 40% Goal Conversion Rate when used as a secondary key pass.
By measuring the speed of forward play in meters per second, we can determine how dependent effective through balls are on faster speed-of-play. We have divided forward speed-of-play into the following categories:
Faster Play - Over three meters per second
Normal Play - Over 0.7 meters per second
Slower Play - Less than 0.7 meters per second, including backwards
As we can see from this 500 goal sample, while it is possible to score from Through balls with average and slower speed-of-play, 80% of shots come from the Faster Play bucket along with 79% of goals. As those percentages also demonstrate, overall Goal Conversion Rate is unaffected by speed-of-play: once a player is behind the defense, and often 1v1 with the goalkeeper, everything becomes equal.
We analyzed 18 different types of through balls to identify those which provided the best conversion rates with good volume. From those, we selected the best-performing passes.
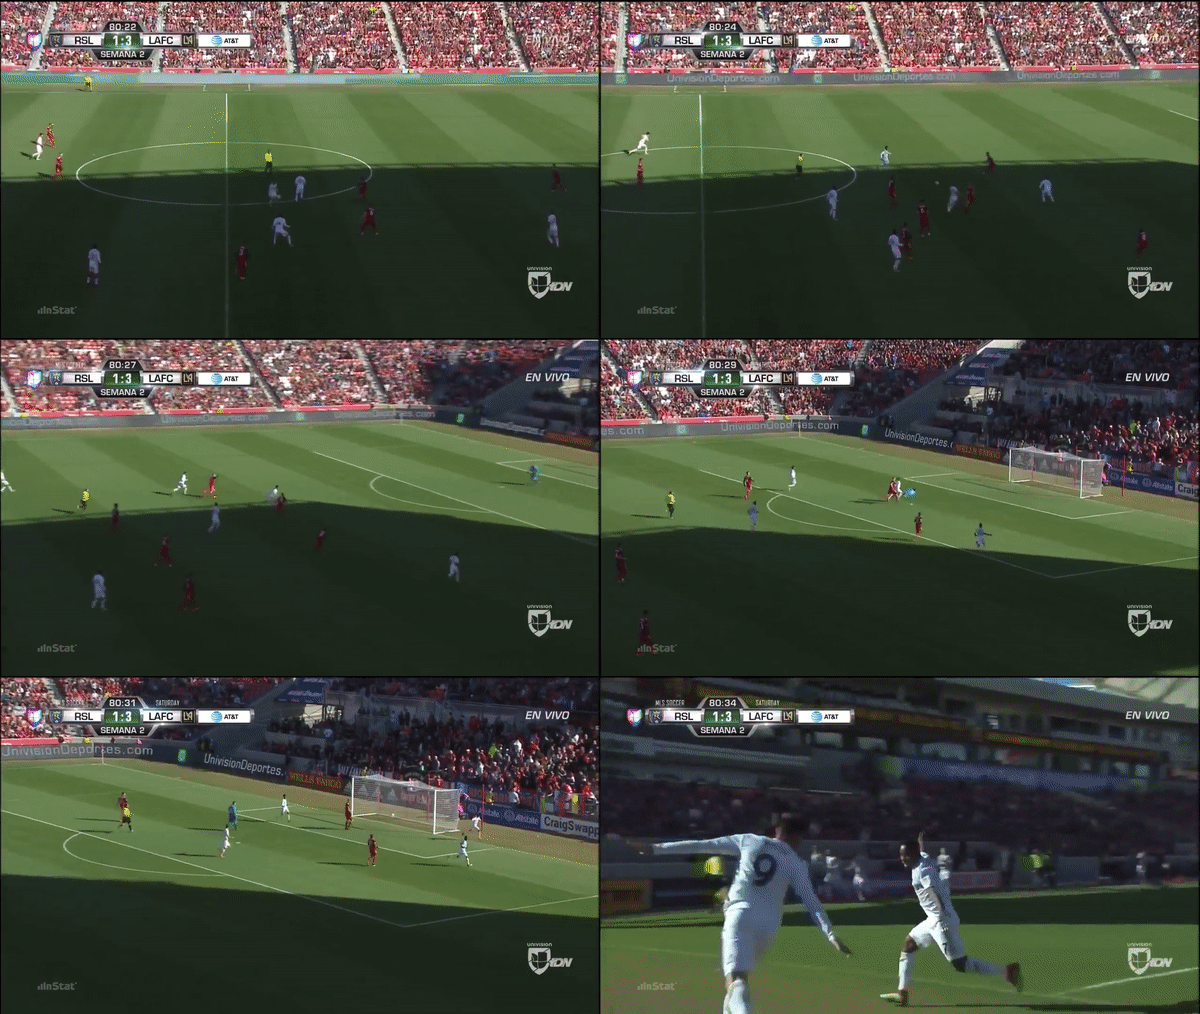
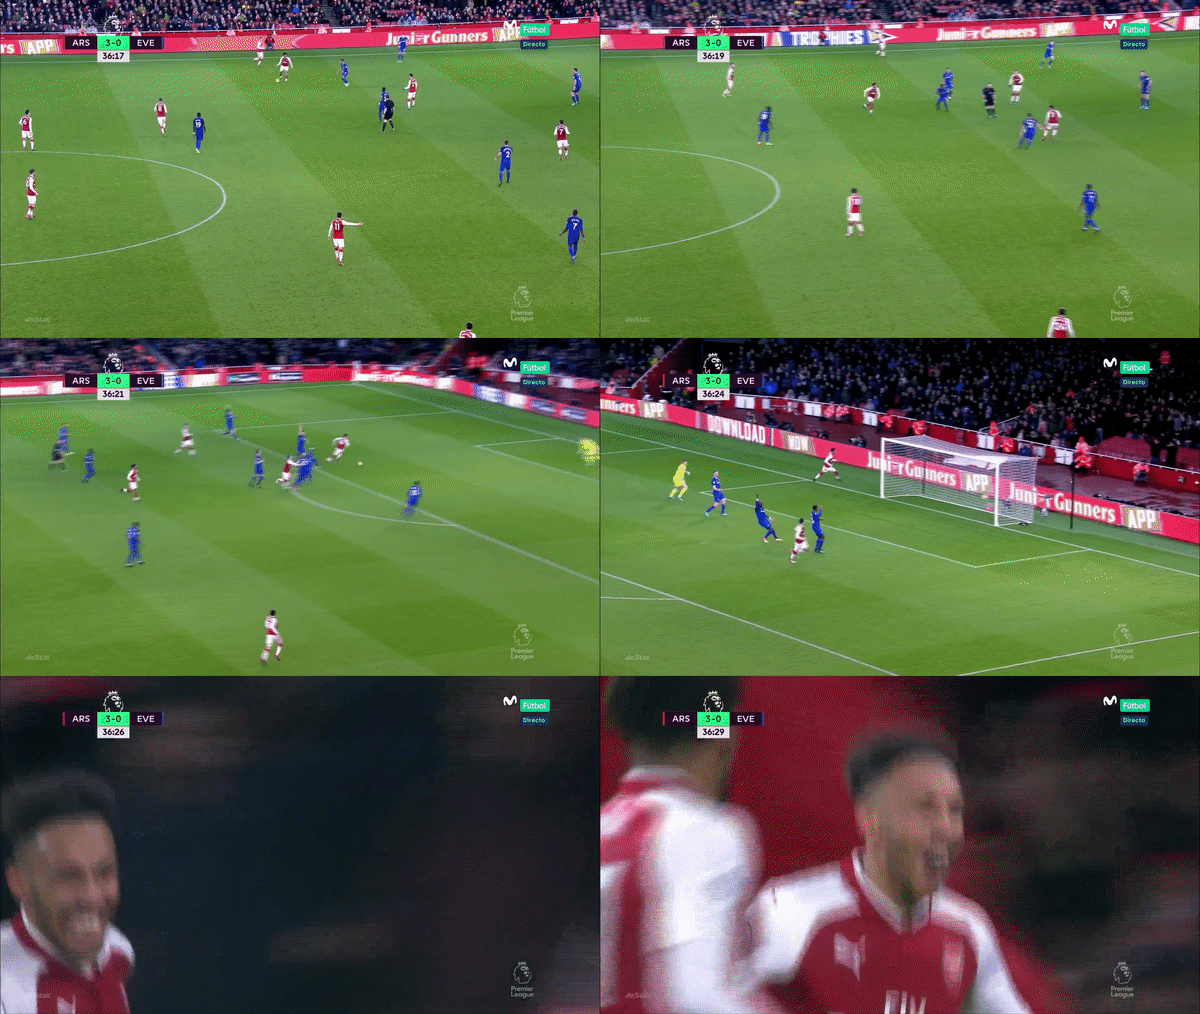
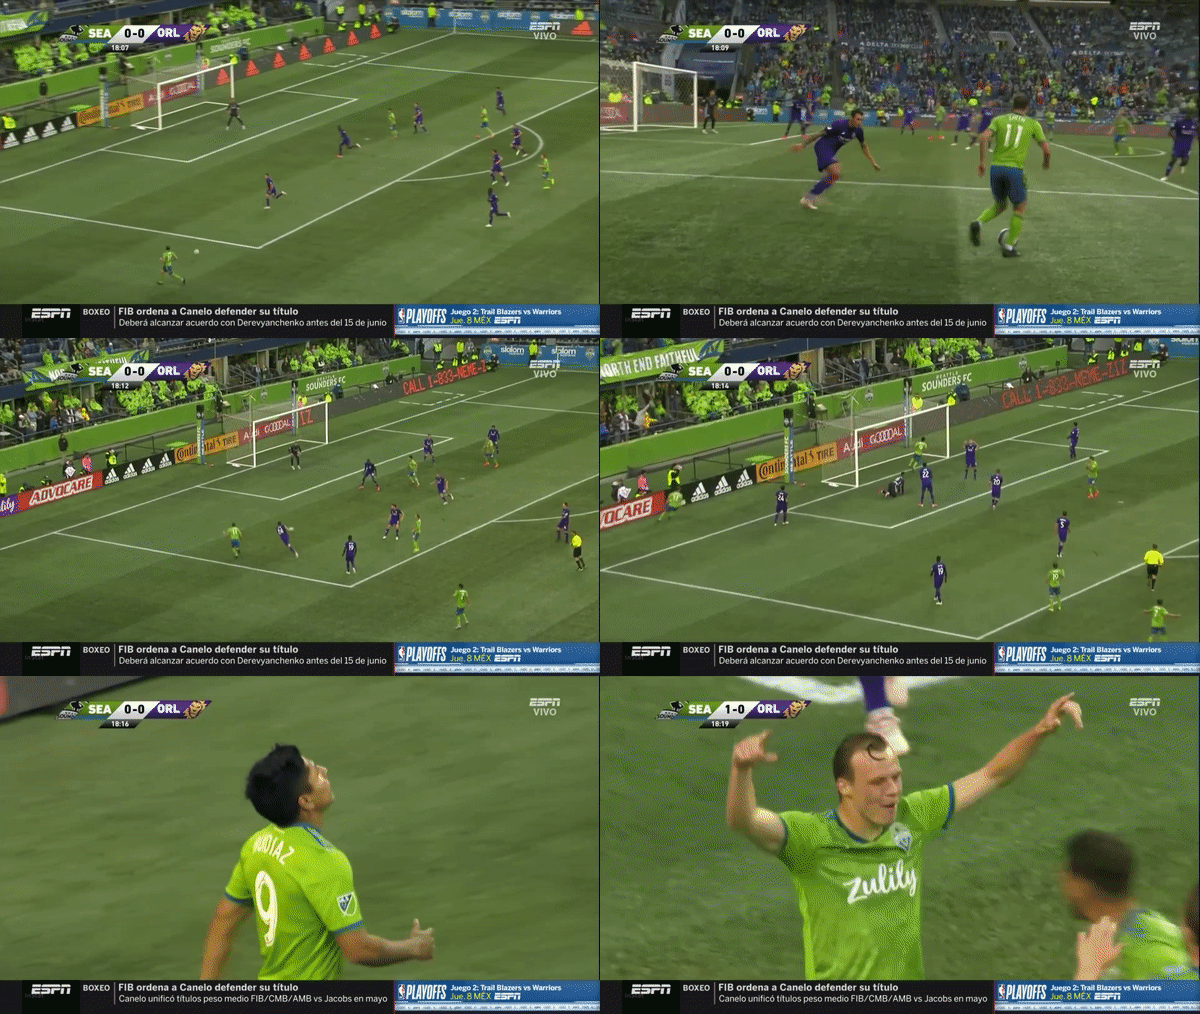
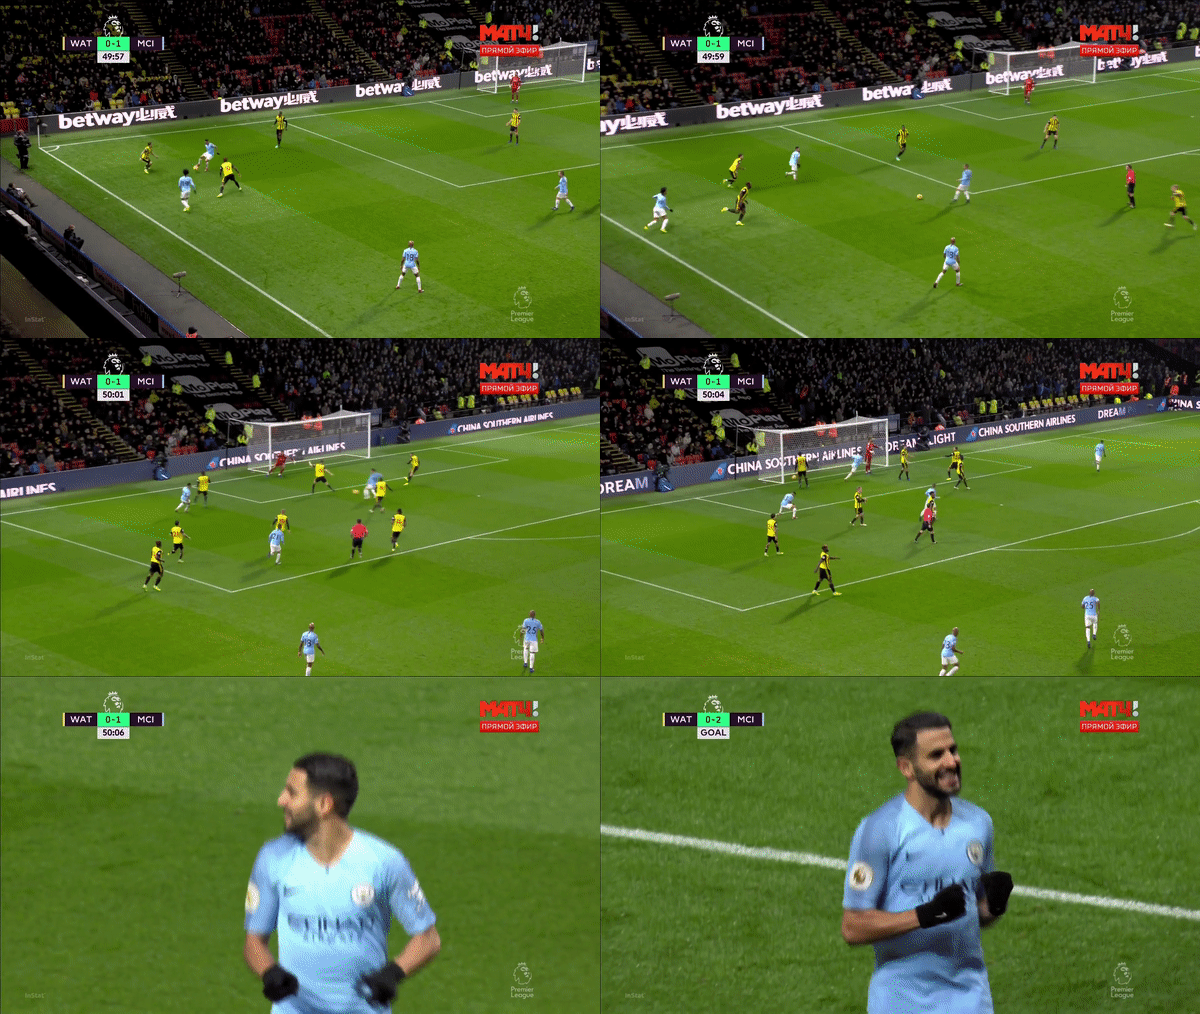
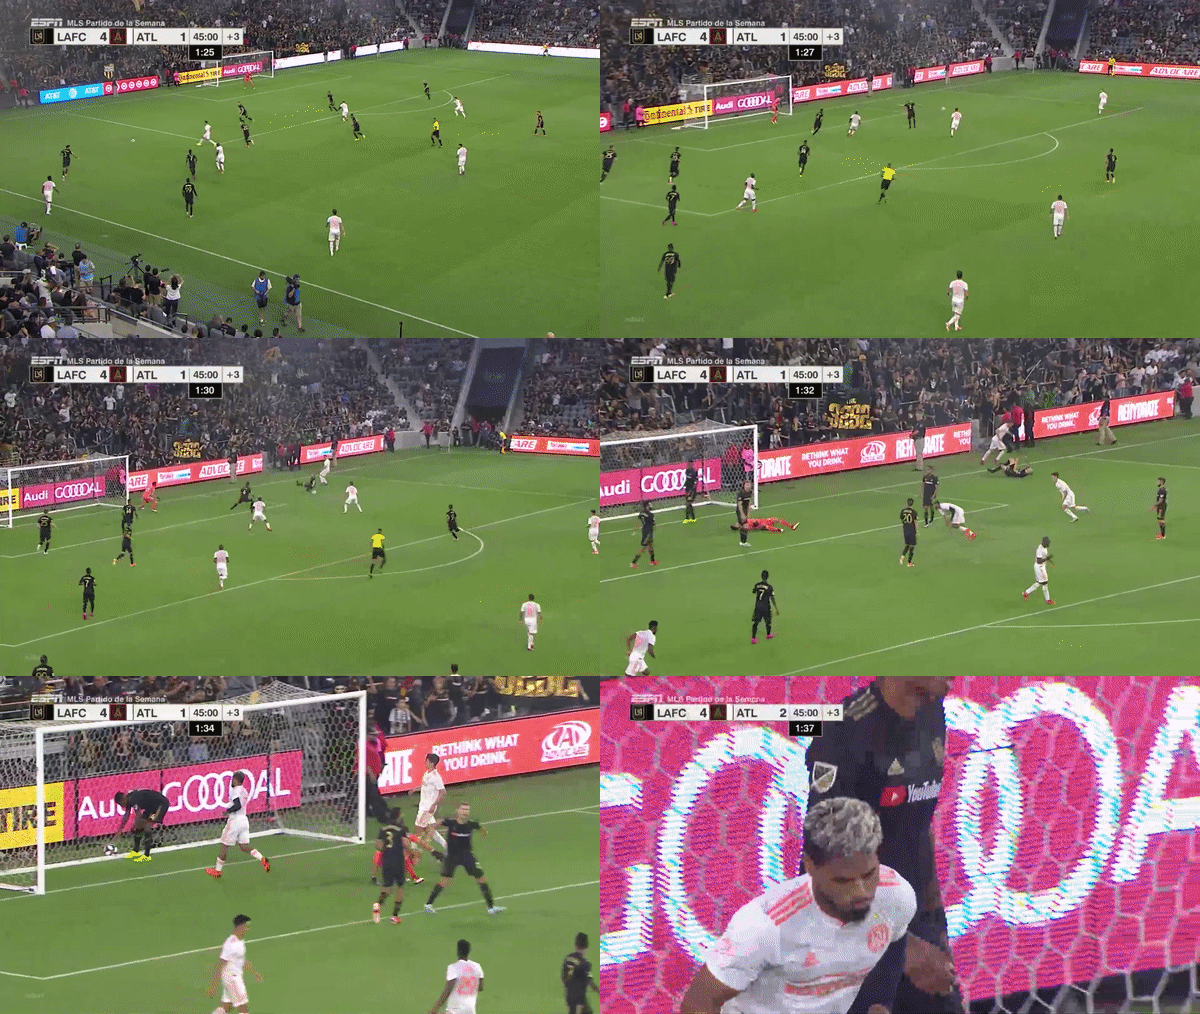
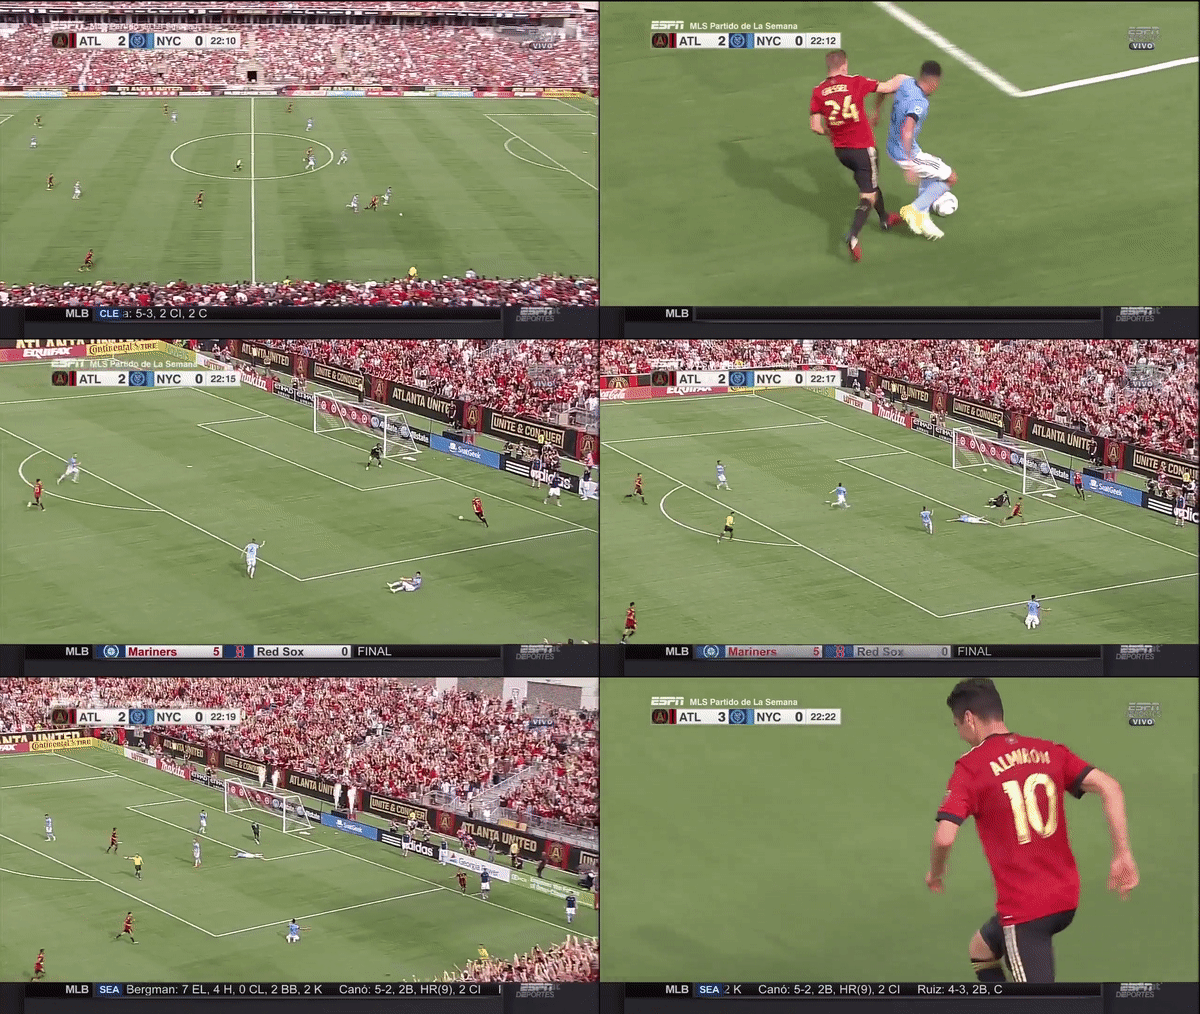
Here are some clips for the best-performing Through ball passes:
Top Through ball Type - #16: Medium length diagonal to or across goal
Through ball pass type 16 (out of 18 types of passes) across the face of goal was our top-performing through ball providing both Great and Good xG shots from lofted (chipped) balls and ground balls at both Faster and Normal speed-of-play.
Top Through ball Type - #17: Medium length diagonal to the arc
Through ball pass type 17 outside the box was our second-best-performing through ball providing both Great, Good, and Average xG shots from lofted (chipped) balls and ground balls at the Faster speed-of-play.
Top Through ball Type - #10: Short vertical ball from beside the arc
Through ball pass type 10 from beside the penalty box arc was our third-best-performing through ball providing both Great and Good xG shots from ground balls at both Faster and Normal speed-of-play. To get higher goal conversion rates, play the ball toward goal a bit rather than a straight vertical ball.
Other effective Through balls with high Goal Conversion Rates
Through ball pass type 2 across the face of goal from outside the box is a less-used ball but provides Great and Good xG shots from lofted (chipped) balls and ground balls at both Faster and Normal speed-of-play. This is the preferred ball for best results from lofted through balls. Play it from the half-space to the penalty dot.
Through ball pass type 12 is the best through ball away from goal. It is played from in front of the penalty box arc toward the near post. It produced the best results for a through ball away from goal, although better goal conversion rates are seen if the ball is angled less away from goal. This can work as a lofted (chipped) ball but is much better as a ground ball.
Interestingly, the most effective direction for a Through ball overall is slightly away from goal as this pass type above demonstrates.
What is common among all these pass types is their ability to get behind defenses when playing with vertical pace. While it’s not necessary to be on the break, there needs to be a shift to moving forward with urgency to have the opportunity to use them given the higher percentages of goals scored from faster speed-of-play.
Carl’s Tips: Playing Through Balls
Through balls against packed blocks and low blocks are tough, for obvious reasons. These types of passes require verticality and space in which to play so the Through ball can be successful. The keys to create these types of opportunities, which will be discussed in my article in implementation in training, is how and where you occupy defenders: If you overload players centrally but also have no presence wide, there’s no legitimate reason why the defense will be prone to being cut open.
My next article will touch on the importance of providing multiple threats in the “progression” phase of play so when it’s time to play the killer final ball, the opposition are at their most vulnerable. Creating these scenarios in transitional/counter attacking situations are a little more straightforward, but still require good movement from the player on the receiving end, and recognition of when to play the pass from the initiator.
Scoring from the Cutback Pass
Cutbacks are almost as good as Through balls for scoring goals, but they are even less frequently attempted.
If you didn’t watch the earlier video, the bars above represent shots per 0.01 xG, and the highlighted part of each bar represents the number of goals. Notice the highlighted bars are much higher here because shots from cutbacks, like through balls, are converted at much higher rates than most shots.
The original pasa de la muerte, a Cutback is a very effective way to score a goal, and its characteristics are different enough from a Cross that we have separated it out. Cutbacks can be sniffed out by defenses and result in a lot of blocked passes, but many of those go out for corners which adds somewhat to their danger.
An insane 97% of shots from cutbacks are in the Great, Good, and Average xG tiers and 99% of goals from cutbacks come from these tiers. The “downside” of this pass of death really only comes from the higher pass block and shot block rates, plus the fact it almost has to be finished with a one-time shot.
And unlike through balls, cutbacks don’t lend themselves very well as a set up pass for another killer ball. While they get pretty good results as secondary key passes with a 14% Goal Conversion Rate, that is more likely due to their close proximity to the goal than their danger as a secondary key pass type.
According to our six profiled leagues, cutbacks occur at a rate of 1.56 per match with a 32% completion rate. Roughly 25% of completed cutbacks are turned into a shot.
As we can see from this 500 goal sample, cutbacks are able to be created and scored at better rates than through balls on normal and slower speeds-of-play. Still, 59% of cutbacks are scored during faster play. Blocked shots occur more often than goals during average and slower play.
Like we did with through balls, we analyzed 18 different types of cutbacks for those that provided the best conversion rates with the better volume. From those, we selected the best-performing types.
Here are some clips for the top-performing Cutback pass types:
Top Cutback Type - #2: Short pass from beside the six to in front of goal
Cutback pass type 2 of our 18 profiled cutbacks produced the best results. This ball is played from right beside the six-yard box to just inside or just outside the top of the same box.
Top Cutback Type - #10: Beside the six toward the back post
Cutback pass type 10 of our 18 profiled cutbacks produced the second-best results. This ball is played right beside the six-yard box to the top of the six by the far post.
Top Cutback Type - #12: Typically from deeper and toward the near post
Cutback pass type 12 of our 18 profiled cutbacks produced the third-best results. This ball is played right beside the six-yard box to just beyond the near post and inside the six-yard box.
Other effective Cutbacks with high Goal Conversion Rates
For a chipped ball, Cutback pass type 12 to the back post is the best place to put this cutback, and it can be finished off with either a head or a foot.
Cutback pass type 11 sends the ball in the vicinity of the penalty dot. This is considered the “classic” Cutback location but is actually only the fifth-best type.
You know this is the one you were thinking would be #1. Well, it’s pretty good. Faster play on the ground works better for balls heading toward the penalty dot. What holds it back are the longer length and the potential to have extra defenders between ball and goal. Those two factors knock down the Goal Conversion Rate just a bit on this ball. If your players can get the ball closer to the six-yard box or at least get behind defenders, do that instead: that will produce better Goal Conversion Rates.
Carl’s Tips: Playing Cutbacks
Cutbacks are pretty much the perfect goal. The finisher is within the penalty area (usually between 12 yards out and goal), the goalkeeper is recovering to the center of the goal or is out of the equation entirely, and the defenders are forced to face their own goal, so even if the pass fails errors can occur on their end.
As this section touches on, cutbacks are also the least used key pass due to these characteristics. So how do you create the situations for these passes? Teams who score consistently from these are capable of working in tight spaces, putting bodies into the penalty area, and changing the pace of the attack against relatively static blocks, as highlighted previously when looking at the xG tiers. I’ll discuss more about this in an upcoming article.
Conclusion
Top-performing teams typically have one or more of these killer final balls in their arsenal. Through balls and Cutbacks produce much higher Goal Conversion Rates than Crosses, other types of Progressive balls, and shots from just outside the 18-yard box. They should be trained and ingrained so the passing patterns and runs become something players will more naturally make. Watching videos of top teams execute them like we’ve shown here, and educating players on how to trigger them, will help players understand when they should look for situations to play these balls.
Key points:
Using Expected Goals “tiers” rather than Expected Goals “values” may be better for communicating with most players about the quality of shots they are taking and the likelihood of a type of shot to score. Knowing when to forego on a Poor xG shot is essential.
Through balls and Cutbacks are the most dangerous balls in open play that lead to goals. Almost every one of these shots is in the Average xG to Great xG tiers, making it easy to encourage players to look to create these over other shots when possible.
Understanding how and where to make these passes and the movements and patterns that create them will create smarter players.
Incorporate one or more of these types of killer balls into your training repertoire and ensure that they are a part of your principles of play and your game models have a way to utilize them. Talk to players about game situations that trigger the opportunities to use them.
About Jamon Moore
Jamon is a high-technology industry executive overseeing business agility transformations. In addition to being a contributor for American Soccer Analysis, he is a credentialed media member covering the San Jose Earthquakes from mostly an analytical perspective. Jamon can be contacted via Twitter, and club analysts and executives can connect with Jamon on LinkedIn.
About Carlon Carpenter
Carlon is the current Tactical & Video Analyst for StatsBomb, one of the largest soccer data companies in Europe. Carlon also works as a contract employee for the U.S. Soccer youth national teams, working as a performance analyst for the U-17 men’s national team. Carlon can be contacted through his LinkedIn account or via Twitter.


