You say you want a Revolution? Possession with Purpose From a Different Angle

A superb run with five wins and a draw in six games; by most standards that is a compelling argument for consistency.  I agree and their overall Composite Possession with Purpose Index rating continues to climb. They've (New England) climbed from 17th in PWP (week 5) to 7th after week 11; a superb shift of 10 full places in 6 weeks.

So in considering this giant push forward I'd like to take a different approach in how the data points from PWP can be viewed.  

This is new so please bear with me for a minute or two as I set the context.

Below are a number of diagrams referencing my PWP indicators for a few teams; the diagram being used this time is the 'doughnut' diagram from Microsoft Powerpoint.

The interesting thing about this diagram is that it allows me to offer up a view on my PWP data points that isn't relative to the exponential relationship (a line). Instead, it allows me to picture the overall tenor of PWP data points in relationship to themselves as being a part of a 'whole'; with the 'whole' being PWP.

I feel confident I can take this approach since my Expected Wins 2 correlation for my data points is ~.97 (R2) --- as near to rock solid as you can get.

Other context points include:  

  • The teams used in this analysis are Seattle, New England, Montreal, Portland and last years' Supporters Shield winner (New York) plus last years bottom dweller (DC United)
  • Reminder in case my explanation was a bit wordy above - the percentages indicated in the doughnut are not the percentages of those activities relative to the game; they are the percentage of those activities relative to each other with 100% being all those activities added together.
  • Source - as usual the MLS Chalkboard and the MLS Statistics Sheets
  • Gold Stars on the diagrams are intended to show you where differences occur.
  • The team name on the outside of the doughnut is the outer ring of data and the team name on the inside of the doughnut is the inner ring of data.

To begin...

PWP Doughnut Diagram Week 11 NER v MIFC

The volume of Final Third passes successfully completed by New England (29%) is 3% points higher than Montreal (26%).  Note also that Montreal has a greater percentage of PWP outside the Final Third (30%) than New England (28%). Both of these indicate to me that New England is more focused on penetrating and creating than Montreal.

For the future I will check into these three areas when looking to see if a 'direct attacking approach' can be better differentiated from a 'ground-based' (short passing scheme) approach.

The actual volume of penetration is higher for New England as well (11%) versus (7%). And like my regular PWP analysis the data here also supports the fact that teams who are more patient in creating shots taken (6% for NER versus 11% for MIFC) end up with more goals scored.

I did ask Matthias Kullowatz about the specific shot data for New England and Montreal; ~60% of Montreal's shots on target have come outside the prime scoring zones 1 & 2 while ~68% of the Revolution shots on target have also come outside of zones 1 & 2.  So what's different?

I think it's down to time and space again; though it could be the Revolution have better strikers - but when you see the DC United doughnut diagram a bit later I think it's back to time and space; and with fewer shots taken and more patience in the final third that seems reasonable to me.

Now for a contrast that might be better at explaining individual mistakes and bad fortune more than a bad 'style/system'...

PWP Doughnut Diagram Week 11 SSFC v PTFC

Notice no 'gold stars'; why? Because there really isn't that much difference between how these two teams execute the six steps of PWP.

What separates these two teams in the league table are individual mental mistakes in defense - Portland sit on ten points while Seattle have 25. Through the course of this year the Timbers have dropped 7 points due to red cards and penalties - they did both against Columbus Saturday night!

In considering the 'sameness' of the data I expect as time passes an output similar to this could highlight 'individual mistakes' and perhaps 'good/bad luck' when it comes to rebounds and deflections - again recall Saturday night when Futty Danso deflected a shot and notched an 'own-goal'

All told things went pretty well for Columbus, a red card by their opponent, a foul in the penalty box by their opponent for a PK and a deflected own-goal by their opponent. If I were a Columbus fan I'd be pretty pissed they didn't win - bad luck for the Crew!

However viewed I'll revisit this diagram later when the Cascadia Cup battle heats up.

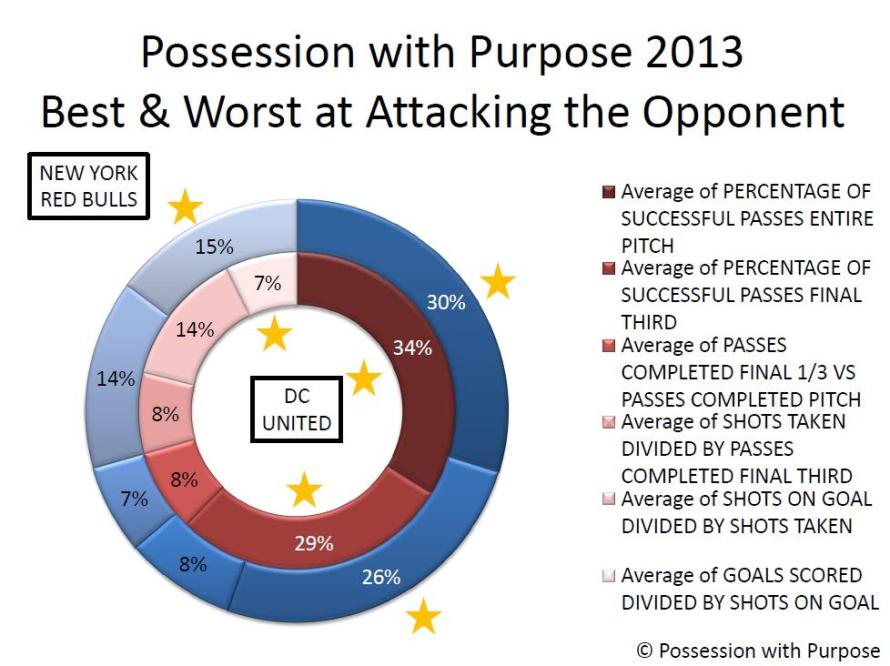
So here's the doughnut view of New York compared to DC United last year and then a bit further down how they look compared to each other this year.

PWP Doughnut Diagram NYRB v DCU 2013

First off - let's not forget Ben Olsen was not fired and perhaps this doughnut diagram can also help explain why given the overall poor performance in results last year for DC United.

Notice that the team does exceedingly well in comparison to New York with respect to Passing, penetration and creation; they actually exceed New York in the first two categories and only fall off when it comes to goals scored (7% for DC United versus 15% for New York).

So I'd offer that the system Ben Olsen ran last year worked - what he lacked was a pair of good strikers.  And if you recall the Montreal doughnut earlier the outputs from DC United do not mirror those of the Impact!

They added Espindola and Johnson and shored up their defense a bit; that also included adding Amos Magee to the staff.  Remember him as the Defensive Coordinator for Portland last year (I think - others can confirm or deny that I'm sure)

Bottom line here - the system didn't change and the Head Coach didn't change and I'd offer that was appropriate...  now for the same diagram this year:

PWP Doughnut Diagram Week 11 NYRB v DCU 2014

In closing:

Note the increase for DC United in the final category - goals scored versus shots on goal - pretty compelling information to reinforce that the system used last year is the same system used this year and the difference - major difference - is the addition of two quality strikers.

I'm just in the learning stages on how this new doughnut diagram will take shape - I'm pretty sure it will have at least one hole in it - I'm hopeful there aren't a lot more.

Some changes afoot with OPTA and MLS - I see OPTA incorporated the Final Third Passing Accuracy suggestion - just need to find out if crosses are included in that metric???

As for the new MLS Chalkboard - I'm not sure how that will work if the 'numbers' of activities are not available to count when it comes to defensive activities and 'touches' for players...

And yes, the old Chalkboard still appears to exist given a separate link within previous articles but it's unclear if this change will be a permanent change for next year - or even the World Cup for that matter...

As for This Week in PWP; if you saw my tweets yesterday you know the top Attacking and Defending PWP teams of the week; New England in attack and Toronto in Defense with the Reds taking the Composite PWP Index top spot for Week 11.  

Sporting KC, along with LA Galaxy remain atop the Composite PWP through Week 11 while the Revolution moved to 7th and Columbus dropped to 4th as Real Salt Lake are now in a comfortable position of 3rd best overall.

Finally, this view also gives you and idea of what percentage each team gleans from each of the PWP Six Steps data points in the calculation for the overall Index number.

Best, Chris

Playoffs are a real possibility for the Whitecaps

Vancouver finished outside the playoff picture last year in a conference that allows 55.6 percent of its members to advance into November. Despite passing the "eye test" with a lot of talent, and despite producing a positive goal differential, the Whitecaps did little to convince our more advanced soccer statistics that they were a good team. Vancouver fired off 12.9 shots per game, but allowed 15.1. Furthermore, when those shots are valued based on quality, Expected Goals suggests Vancouver was below average, posting a negative xGD. Supporters may have pointed to their excellent shot accuracy and finishing rates as signs of talent and reason for optimism, but those things don't stabilize quickly, and the man who was most responsible deserted them for Liga MX. To kick off the season, we provided previews of all 19 teams. Jacob covered Vancouver, and he justifiably wrote, "As the 2014 season gets set to begin, Vancouver is one of just a few teams in the league that don’t appear to be as good as last year." Losing internationals Kenny Miller, Y.P. Lee and Camilo would probably make any MLS team worse, and before the acquisition of Matias Laba, Steve Beitashour was probably the most notable addition. On average, you readers picked the Caps to finish 7th in the West, and 76 percent of you guessed that they would miss the playoffs. I'm quite confident that I picked them to finish in 8th place. Missing the playoffs may very well still happen, but that outcome doesn't seem to have a majority of the probability anymore.

I think it's fair to say that Vancouver's 2014 has been surprising for most everybody. After ten games, nearly one-third of a season, Vancouver finds itself in third place. More importantly, it has an above-average shot attempt ratio (1.1) and positive expected goal differentials both overall (+0.13 per game) and in even gamestates (+0.36 per game). In 2013, the first 10 games of the season proved to be reasonably predictive of points earned in the final 24, as shown below.

Predictor Correlation P-value
GD 0.43 0.091
AttRatio* 0.55 0.000
xGD 0.78 0.000
xGD (zero) 0.75 0.000

A team's actual goal differential during the first 10 games had the weakest correlation to its points earned in the last 24 games, as any reader of this blog would have expected. But look at the correlations between xGD in the first 10 games and points earned in the last 24 games. Only more seasons of data will tell us if the correlation is truly that strong, but it's definitely a good indication for Vancouver. The xGD model would expect them to earn another 37 points, totaling 53 points for the season---a figure that, in combination with our playoff chances, suggests the playoffs might be more likely than not likely for the Vancouver Whitecaps.

*The correlation for Attempt Ratio was calculated from all team seasons between 2011 and 2013, while the other correlations could only be calculated from 2013 with the available data.

Expected Wins #2 - After 184 MLS Events (92 Games)

Hopefully most of you read Part I of my series on Expected Wins in Major League Soccer. As a quick reminder the Expected Wins analysis is my internal data quality review on the seven data points I use to support my quantitative Possession with Purpose analysis; the stronger the correlation these data points have the more confidence I have in the overall Indices that are created to assess team performance.

For your benefit, in case you forgot, here are the seven data points I continue to analyze as we reach the 92 game point in MLS; which equals 184 events:

  1. Passes Attempted Entire Pitch
  2. Passes Completed Entire Pitch
  3. Passes Attempted Final Third
  4. Passes Completed Final Third
  5. Shots Taken
  6. Shots on Goal
  7. Goals Scored

All data points, at this time, have equal weight.

What is interesting is that over the week to week course of the season 40% (20/50) of the weekly top five teams, in Attacking PWP, have averaged less than 50% possession in their matches.  

For me that's pretty cool as it indicates this analysis is not really biased towards teams that use a shorter-passing scheme in attack.  Week 5, 3 of 5 teams were under 50% and the other two were both under 51% possession.

Some of those teams are possession based teams like DC United, Portland and Seattle but in that week the margin of possession did not have as much effect as the ability of those teams to finish quality chances - the top three teams that week all scored goals equal to their shots on goal.

The five teams that week who exceeded 80% in Passing Accuracy; usually a good indicator of ground based attacking all finished outside the top 5.


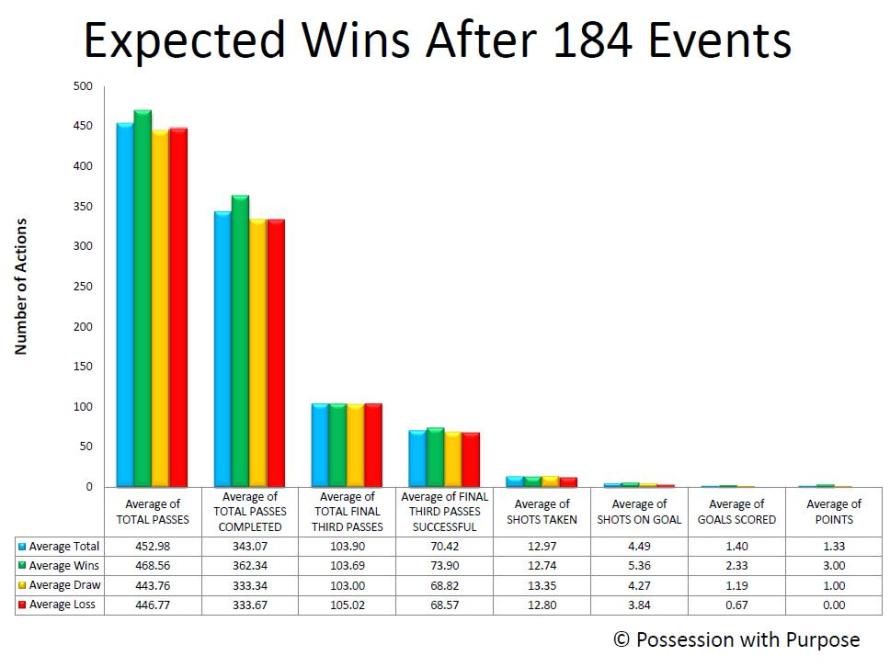
Moving on after that tidbit, here's the averages for overall (blue bar), teams that win (green bar), teams that draw (orange bar) and teams that lose (red bar).

Expected Wins 2 Averages

Facts as they exist today after 184 Events in 2014:

  • The overall tenor of the data points and their relationship really hasn't changed that much since XpW 1.
  • Teams that win average 51.11% Possession; losing teams average 48.89% Possession, (lower)
  • Teams that win average 76.39% in Passing Accuracy; losing teams average 74.10% (lower)
  • Teams that win average 20.48% Penetration in the Final Third based upon Total Passes completed; teams that lose average 20.32% (lower)
  • Teams that win average 18.64% Shots Taken per pass completed in the Final Third, losing teams average 19.22% (higher)
  • Teams that win average 42.67% Shots on Goal per Shot Taken; teams that lose 32.13% (lower) (by over 10%!)
  • Teams that win average 46.18 Goals Scored per Shot on Goal; losing teams 17.03% (lower) (by over 29%!)

Like after XpW 1 (102 Events - 51 games) losing teams shoot the ball more often, on average, but are less accurate when it comes to putting those shots on target and into the net.  Patience in creating quality continues to outweigh quantity...

Overall, the averages for Shots on Goal for winning teams has increased from XpW 1 (4.90) to XpW 2 (5.36); basically the better teams have gotten better and the losing teams have gotten worse (3.84 now) versus (4.10 in XpW 1).

I wonder how that trend will continue through the rest of this year?

Tthe 2% gap in Passing Accuracy between winning teams and losing teams has held from XpW 1 to XpW 2.

The gap in Shots on Goal has increased in losing teams to 10% as opposed to 9% (XpW 1).

The gap in Goals scored has remained near steady at roughly ~30%; though slightly smaller in XpW 2.

Losing teams still continue to take more Shots than winning teams; 12.74 (winning teams) to 12.80 (losing teams) but... that gap has dropped since XpW 1 - perhaps losing teams are looking to be more patient in their shot selection?

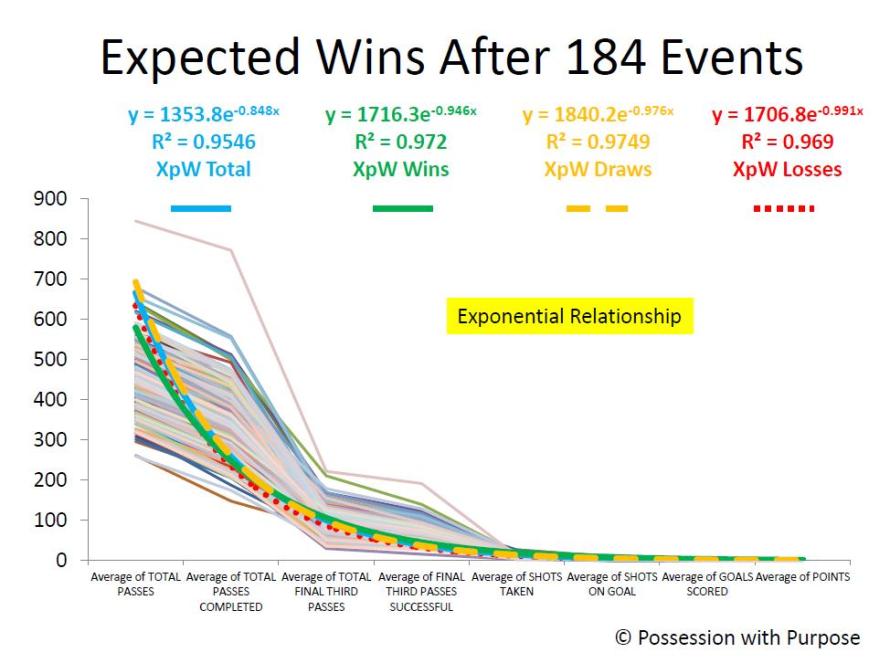
So how does the overall data relate in an Exponential Relationship?

Expected Wins 2 Trend-lines

Observations:

The light shaded lines are the lines of data as in XpW 1 - and the trend-line colors remain the same.

This time the R2 has dropped just a tad.98 to .95 - all things considered most would consider that correlation Rock Solid... I do - and the correlation of these data points, viewed as a whole, have a higher correlation together than Goal Differential (R2 = .88) to Points in the League Table.

Goal differential is usually a great indicator but it also remains a qualitative statistical indicator not a quantitative indicator.

Like last time there remains a difference in the R2 between winning teams, teams that draw, and losing teams; with draws now having greater correlation than wins.  Why?  I'm not sure - but as noted by the closeness of all the data points there still remains a fine line between winning, losing and drawing.

Last time I felt that helped explain the difference between mistakes or unlucky breaks - I continue to sense that is the main difference.  So might this be an indicator of luck - I don't know - what do you think?

I have seen discussions of late, on Telly, and in some articles written elsewhere, that focus more on 'space available' as opposed to just Shots Taken...  hopefully that trend continues!

I also remain hopeful that OPTA and other statistical web sites will offer up more critical events taking place in the Final Third...  One other article written since XpW 1 is my analysis (as promised in Xpw 1) on defensive indicators; here's a link to Hurried Passes and those details.

In closing:

I still don't have enough data, in my opinion, to offer additional thoughts on individual team performance relative to home and away games; that probably won't have statistical reliability until the midpoint of the season (game 323 - events # 646).

There are trends but I'll save that for another article, enough for now.

Best, Chris


MLS Head Coaches: Leveraging PWP Analysis on Performance

I promised this year, at various times, to offer some thoughts about how Possession with Purpose can be used to support analysis on how well Head Coaches might be performing compared to others. As a reminder from last year; five of the bottom six teams in my PWP Composite Index had coaching changes, Columbus, Chicago, San Jose, Toronto, Chivas USA, and then after an early exit from the Playoffs; Montreal.  Other teams making changes included Vancouver, Colorado and FC Dallas and the depature of Kreis for NYCFC. All told, a total of 10 teams made changes in Head Coaches for one reason or another.

Will this year have similar results, and if so, who?  I don't claim to prognosticate coaching changes and the firing of Head Coaches, but changes happen, and last year's information, relative to the bottom six teams in my Composite PWP Index, is pretty compelling at first glance.

So after reading an article offered up by Jason Davis at ESPNFC "Three MLS coaches on the hot seat," plus releasing my article earlier this week on Crosses offered in MLS, I figured the timing was pretty good for my first installment.

Here's some of my initial information for consideration on "system of attack":

  1. For home games Frank Klopas, Mark Watson and Frank Yallop-led teams are the top three in MLS that offer up more crosses per pass attempted in the final third.
  2. For away games Klopas, Watson, Yallop and Wilmer Cabrera-led teams are the top four teams in MLS that offer up more crosses per pass attempted in the final third.
  3. The relationship of taking points, at home, in the MLS is (-.70) for teams that cross the ball more frequently than others. In other words, the teams who cross the ball the most are more likely to lose points (at home) than teams that don't.
  4. The same relationship of taking points in away games holds as well (less at -.37). but still the same logic - the more crosses a team offers in away games the more likely they are to drop points.
  5. Bottom line is these four teams are less likely to win at home or on the road given their current system of attack in the Final Third.

In other words, these teams led by these head coaches use a system of attack that simply doesn't get positive results on a regular basis in MLS; or... these teams, led by these head coaches and general managers don't have the right players to execute that system of attack in MLS.

So how does Sporting KC do it? They are a team that offers up the 7th-most crosses at home and the 5th most crosses on the road, yet they are winning using that system of attack.

Why? I think it's because their GM and head coach, collectively, are getting the right players to play to that system of attack.

So how about overall Team Attacking and Defending performance  (Team Positions in my Composite PWP Index) after nine weeks in: (1) Possession, (2) Passing Accuracy, (3) Penetration into the Final Third, (4) Creating and Taking Shots, (5) Putting Shots on Goal, and (6) Scoring Goals?

After Week nine, four of the five worst performing teams in MLS, in these categories are:

  • Chivas USA (19th out of 19),
  • Montreal Impact (18th out of 19),
  • Chicago Fire (17th out of 19), and
  • San Jose Earthquakes (15th out of 19).

In case you missed it in an earlier article on Expected Wins - the correlation of those data points as a whole is .99 (R-squared); the closer to "1" the better and stronger the relationship.

In other words that means that the relationship of those data points is pretty much rock solid, and that it's a worthy indicator (outside of points in the league table) for objectively evaluating team (attacking and defending) performance.

So while Jason Davis indicates John Hackworth and Caleb Porter as being potential candidates for hot seat discussions, actual evidence available indicates those names don't belong there. Indeed, there are other teams performing, as a whole, much worse than Philadelphia or Portland.

Three teams performing worse at this time include Chivas USA, Houston and Toronto, while Vancouver is behind the power curve compared to Philadelphia and slightly ahead of Portland.  By the way, this is not to say John Hackworth might not belong in a list a bit later this year - but for now I think it is highly speculative to even put in print that he's a potential hot seat candidate.

And with respect to Caleb Porter - it does seem, at times, that writers outside of the Portland area speculate and use the Timbers large supporter base to artificially increase readership in some of their articles... just saying. As a writer covering the Timbers here in Portland, reading the idea that Caleb Porter is on some sort of hot seat is (softly voiced) bollocks. But that's just me...

In closing:

Given the evidence offered, does it seem reasonable that those four Head Coaches and their associated GM's are worthy of a "Hot Seat" distinction? I think so...

Winning styles come in all shapes and sizes - the critical piece is having the right players to support that effort, and the time to install the system. Klopas, Cabrera, Yallop and Watson all know more about football than I do.

And it's not my place, nor is it the place of any soccer writer (in my opinion) to pass judgment on whether or not someone should get fired or hired.

But... objective evidence indicates that those four teams, compared to others, lack an effective attacking system of play, lack strong overall team performance in attacking and defending while also lacking the most important measuring stick - points in the league table.

I'm sure this is not new, nor rocket science, to those head coaches, general managers, or owners... but... (perhaps?) it is helpful to others.

Best, Chris

You can find Chris on twitter @ChrisGluckPWP

Dynamo Dynamic in Attack and Bulls Bullish on Defense - Week 9 Ends in MLS

Taking a team to L.A. and winning 4-1 sounds incredible until you offer up the caveat that it wasn't against the Galaxy. The doormat this year seems to be shining earlier than last. The Houston Dynamo have dominated in dynamic fashion; wow - good on you Giles Barnes...

So how exactly did that powerful attack look compared to other four-goal outbursts this year - was it really that special?

In all the four-goal games this year, here's a quick breakdown on which teams accomplished that and then who's been tops in their Possession with Purpose and Expected Wins statistics for those games:

  1. DC United vs FC Dallas
  2. Sporting KC vs Montreal Impact
  3. Seattle Sounders vs Colorado Rapids
  4. Seattle Sounders vs Portland Timbers
  5. New York Red Bulls vs Houston Dynamo
  6. Houston Dynamo vs Chivas USA
  7. Houston Dynamo vs New England Revolution
  8. Portland Timbers vs Seattle Sounders
  9. Vancouver Whitecaps vs New York Red Bulls

Tops in overall possession in those high scoring affairs was DC United at 67.04%. Tops in passing accuracy across the entire pitch was, again, DC United at 84.17%.

Tops in penetration percentage based upon passes completed in the final third vs. across the entire pitch was Houston vs. New England at 28.94%.

Tops in percentage of successful passes within the final third was Vancouver at 74.55%. Tops in shots taken compared to passes completed in the final third was Houston vs. Chivas USA at 39.13%.

Tops in shots on goal compared to shots taken was Vancouver at 71.43%; and finally... tops in goals scored vs. shots on goal was FC Dallas at 100% versus Houston.

So while Houston did well this weekend, and got their second four-goal game, it wasn't dominating compared to others - sorry Houston. It was three points (which is the target) but it wasn't really that special when viewing who you played against... more later on just how weak Chivas are in Possession with Purpose.

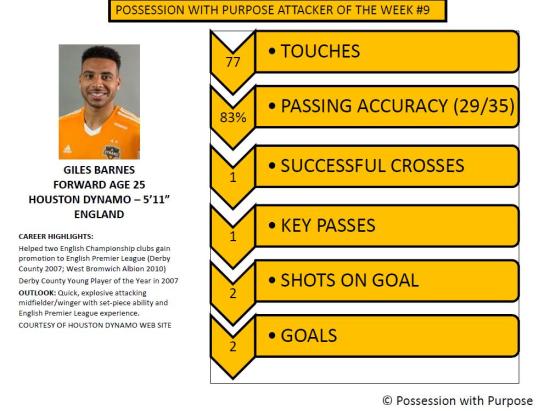
However viewed, Houston still had the best attacking outcome this week. So here's my PWP Attacking Player of the Week... Giles Barnes.

PWP Attacking Player of the Week 10

Moving on to the Defensive side of the pitch - FC Dallas saw red this past weekend and it wasn't just their kit, the Red Bulls kit or Dax McCarty's hair - it was Watson (elementary my dear) who got red.  

Things don't get better for Dallas either - they travel to Seattle for a midweek clash this Wednesday and then must fly down to San Jose for another on Saturday... wow.   Might we see Dallas drop three in a row?  I'm not sure and if you want to know my MLS picks for this week check here.

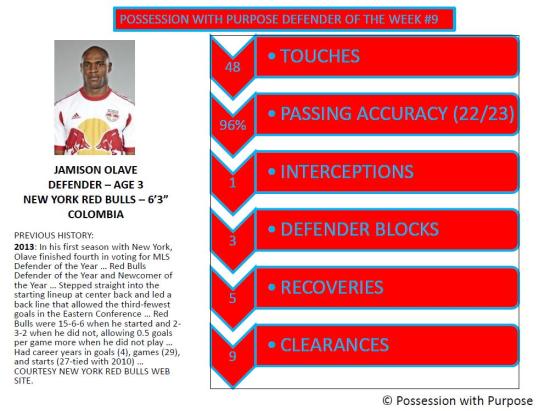
Anyhow, I digress - the PWP Defending Player of Week 9 is Jamison Olave...

PWP Defending Player of the Week 10

So was that a worthy three points for New York and should it have been expected?  I'm not sure and here's some information to consider:

Below is a list of games, this year, where the first team listed got a Red Card:

  1. DC United v FC Dallas
  2. Columbus Crew v DC United
  3. Columbus Crew v Sporting KC
  4. Sporting KC v Columbus Crew
  5. Sporting KC v New England Revolution
  6. Sporting KC v Real Salt Lake
  7. FC Dallas v Chivas USA
  8. FC Dallas v DC United
  9. FC Dallas v New York Red Bulls
  10. FC Dallas v Portland Timbers
  11. New York Red Bulls v Philadelphia Union
  12. Houston Dynamo v FC Dallas
  13. Houston Dynamo v Philadelphia Union
  14. Chivas USA v Houston Dynamo
  15. Chivas USA v San Jose Earthquakes
  16. Chivas USA v Seattle Sounders
  17. Chivas USA v Vancouver Whitecaps
  18. Portland Timbers v Colorado Rapids
  19. Portland Timbers v FC Dallas
  20. Vancouver Whitecaps v Colorado Rapids
  21. Colorado Rapids v Portland Timbers
  22. Colorado Rapids v Sporting KC
  23. Montreal Impact v Philadelphia Union
  24. Chicago Fire v New England Revolution
  25. Chicago Fire v Portland Timbers
  26. San Jose Earthquakes v Colorado Rapids
  27. Seattle Sounders v Columbus Crew

Twenty seven in all and only Colorado, New York, FC Dallas twice, Sporting KC and DC United won games yielding just a 22% chance of winning when seeing Red.

FC Dallas and Chivas USA lead MLS having received Red Cards in four games.  But here's where the more later comes in for Chivas - check this out.

FC Dallas (when short handed) have an Attacking PWP Index = 2.3976.  Their Defending PWP Index = 2.3914 and their Composite PWP Index = .1472.

By contrast, the Goats PWP Indices (at full strength this year) for Attacking = 2.1685; for Defending = 2.5446 and for Composite PWP = -.3760.  If I were a Chivas USA supporter that is a pretty depressing statistical output - FC Dallas, short-handed, are more productive in Attack and more effective in Defense than a full-strength Chivas... wow!

In circling back to my question on whether or not it should have been expected that New York would win?   Perhaps now, seeing how effective FC Dallas is, even when short-handed, it wasn't quite the cake-walk one would expect.  Key for Dallas these next 7 days will be the health of Diaz and the discipline to minimize Red Cards...

In closing...

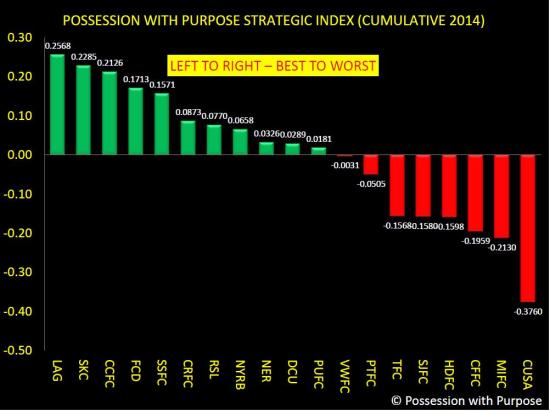
After nine full weeks of MLS here's how things stand with my Composite PWP Index along with a few quick thoughts plus the Top 3 in Attacking and Top 3 in Defending.

PWP Cumulative Composite Index through Week 10

LA Galaxy remain atop the table even with their 1-nil loss in Colorado - if Robbie Keane hits that PK, LA doesn't drop one point.  As for Columbus they drop down to 3rd with Sporting KC pushing up to spot #2.

Seattle, FC Dallas, Colorado and Columbus still stay in the top 6 while RSL continues to move forward - inching one space higher into 7th with New York and New England swapping places.

Note DC United dropped a few places and the bandwidth between the Revolution, United, Union, Whitecaps, and Portland got a bit tighter while Houston pushed forward past both Montreal and Chicago after thrashing Chivas.

Settling into last is Chivas, by a large margin, while the Fire and Impact hover on the low end as well...

Did a change in Managers (Head Coaches) really make a difference when looking at the End State? I'm not sure; for now it doesn't appear that either Klopas or Yallop have really changed things up when viewing the bottom line...

The top three teams in overall Attacking PWP (after 9 full weeks) are FC Dallas, Seattle Sounders, and Columbus Crew - can their approaches in possession continue to keep them there?

The top three teams in overall Defending PWP are Sporting KC, LA Galaxy and New England Revolution - some might offer elsewhere that it is surprising to see the Revolution somewhat higher in the table compared to others; is that surprising?

I don't think so... they have shown pedigree in defending for over a year now and with an improved attack it only stands to reason that their overall position finds them where they are...

Finally, have you made adjustments in your Fantasy teams yet?

If not and you are looking for a consistent (team back-four) you may want to add the Revolution to your list while spending a bit of change in leveraging Lloyd Sam from New York (cheap and cheerful) or latching on to Jaoa Plata if you haven't already...

Best, Chris

PWP-Pick-List Week 10 - weaving Expected Wins into my predictions this week...

A different approach this week just to see how things go.  Instead of leveraging my PWP Indices this week I'm going to leverage my Expected Wins analysis this week. Last week I was 5/9 so my running total on my PWP-Pick-List is 51%.

As background - most teams have had roughly an equal amount of home and away games - the Expected Wins #'s are the R2 values relative to playing either at home or on the road.  It's not 100% enough games but it'll do as a test of sorts...

The higher the number the more effective the team has been in overall Possession, Passing Accuracy, Penetration, Shots Taken, Shots on Goals and Goals Scored... the R2 below does not take into account the points earned (i.e. - those numbers do not reflect points won or lost in the league table)...

So in quick fashion (offering up only wins or losses - no draws) here's my picks for games beginning Wednesday and ending on Sunday:

Canadian Cup Vancouver visits Toronto:  Expected wins Toronto .9979 at home and Vancouver .9997 on the road.  Have most MLS teams twigged onto the 'mistake driven' attack by Toronto where possession really has no meaning?  I think so...  Nelson has, as I've intuited earlier this year, imported a European style of football to MLS. Chelsea has seen some success but has failed to take the EPL Championship.  Is this system good enough to get Toronto in to the Playoffs? I'm not sure  - for now I pick Vancouver winning. 

Houston at home to Columbus: Expected wins Houston .9993 at home and Columbus .9996 on the road - Columbus would normally be favored but with Will Trapp sitting on a Red Card I pick Houston winning.  Besides - it is still early days for Berhalter's system and Kinnear knows it well enough having just played Portland while also playing against Sporting the last few years...  I think the width of Houston is better...

Canadian Cup - Edmonton at home to Montreal:  Expected wins for Edmonton (no idea) and Montreal .9993 - Montreal wins given their budget and higher quality players... if they don't win - wow - they really aren't any good...

Seattle at home to FC Dallas:  Expected wins Seattle .9992 at home and FC Dallas .9990 on the road - Seattle wins; especially with Watson on a Red Card.

San Jose at home to Colorado:  Expected wins San Jose .9989 at home and Colorado .9996 on the road.  Colorado has done extremely well on the road this year averaging 1.25 goals per game - they have speed and the back-four for San Jose doesn't... why on earth Goodson continues to be a potential selection candidate for the World Cup I don't know...  maybe he proves me wrong this game.  For the USMNT sake I hope so...  for now Colorado wins...

Philadelphia at home to DC United:  Expected wins Philadelphia .9996 at home and DC United .9985 on the road; A rough patch for the Union of late and Hackworth is probably pretty hacked off by now - for no other reason than the Expected wins favors the Union I think Philadelphia wins...

Montreal at home to Sporting KC:  Expected wins Montreal .9979 at home and Sporting KC .9998 on the road - Montreal took advantage of a disjointed Union two weeks ago and they may consider have to play some stronger players to ensure a good result against Edmonton.  That and Sporting probably being very upset about dropping three points in New England sees Sporting KC  winning... besides, with Zusi and Besler being away with the USMNT later this year these early games really are pretty important for them.

New York Red Bulls at home to Chicago Fire:  Expected wins New York .9999 at home and Chicago .9996 on the road -The Red Bulls are almost at full strength - Cahill got minutes in their Red Card tainted win in Dallas and it's not likely they will be shut out against a Fire defense that's really watered down again this year - New York Red Bulls win...

Columbus at home to Vancouver:  Expected wins Columbus .9996 at home and Vancouver .9997 on the road - I'm convinced Columbus can play possession based football but can they do it consistently and can they take on a Vancouver team that is pretty powerful in attack?  I'm not sure they do that this next weekend.  So this might be an upset by many but I pick Vancouver to win...

San Jose at home to FC Dallas:  Expected wins San Jose  .9989 (subject to change given another home game earlier in the week) and FC Dallas (also with another away game earlier in the week) .9990 - I suppose San Jose has to put together a run of wins sooner or later - my guess is that it doesn't happen here - the attack, if Diaz is healthy is just too strong and the back-four, as noted before, is simply too slow - even with Watson having to sit with a Red Card against New York...  (edit - Watson sits against Seattle) FC Dallas wins...  that doesn't mean San Jose can't score in this game - Dallas remain weak at the back and that might be the telling downfall for Dallas again this year when push comes to shove...

Portland at home to LA Galaxy:  Expected wins Portland .9953 at home and LA .9999 on the road; LA has higher Expected Wins but Portland are improving and LA just lost on the road to Colorado - tough game here and if I had to pick a draw this week it would be here.  For now, unfortunately my Expected Wins indicates LA with a win but I will go with Portland to win.

Colorado at home to Chivas USA:  Expected wins Colorado .9983 at home and Chivas .9997 on the road.  Another one going against the grain based upon Expected wins - I just don't see Chivas winning this game no matter how well their attacking data points relate to each other...  besides speed kills and Colorado has speed up top with Brown... Colorado wins

New England at home to Seattle:  Expected wins New England .9990 at home and Seattle .9997 on the road.  A true test for New England in matching their solid defense against one of the most potent attacks in MLS - an early statement game, in my opinion for the Revolution.  They took it to Sporting KC against the odds at home not too long ago and this one will be a test as well.  For now I have more confidence in the attack of Seattle creating and scoring more goals than the defense giving away more goals to New England... Seattle wins...

Houston at home to Real Salt Lake:  Expected wins Houston .9993 at home and Real Salt Lake .9997 on the road.  Jaoa Plata has shown his value this season and his pairing with Saborio is simply dangerous - that coupled with the strong Diamond midfield makes RSL very hard to beat anywhere.  And with Houston having a game earlier this week I see RSL taking three points...

Best, Chris

"Hurried Passes" - Could this be a new Statistic in Soccer?

Aye... the NFL track 'hurried throws' -  why doesn't a Statistics agency involved in Soccer track "Hurried Passes"? I'll get to that but first I need to set some conditions.

If you've read my article on Expected Wins  (XpW) it seems reasonable that a teams' Passing Accuracy in the Final Third has great value in working towards generating quality shots taken that are more likely to be on goal and (therefore) more likely to go in.

So what activities does the defense take to mitigate successful passes (i.e. generate Unsuccessful Passes)?

Before digging in, I'm not the only one on American Soccer Analysis looking into Defensive Statistics; Jared Young has put together an interesting article on Individual Defensive Statistics that may be of interest.

Similarities in our work come from collecting 'like' defensive activities; Tackles Won, Clearances, Interceptions, etc...

Additional twists in my efforts will be to fold my Opponent team attacking statistics in with my team Defense Activities to see what correlations might be present.

My data comes from the first 71 games in MLS this year (142 events) and my source is the MLS Chalkboard.

Bottom line up front (BLUF) - however this data plays out it needs to make sense so here's my operating conditions on Team Defensive Activities in the Defending Final Third and which ones I will focus on that can be associated with an Unsuccessful Pass in the Final Third:

  1. Recoveries - usually associated with 'loose balls' generated from some other activity like a deflection, rebound, or perhaps an unsuccessful throw-in that hits a head and deflects away (uncontrolled) that another player latches on to and then makes a move showing control the ball.  Therefore Recoveries are not counted as a specific defensive activity that would impede a successful pass - it is the resultant of another activity that impedes a successful pass.
  2. Clearances - one of the better examples of a defensive activity that impedes a successful pass - especially those generated from crosses but not necessarily called a blocked cross.  Therefore Clearances will be counted as a specific defensive activity that impedes a successful pass.
  3. Interceptions - pretty much self explanatory - an interception impedes a successful pass - therefore Interceptions will be counted as a specific defensive activity that impedes a successful pass.
  4. Tackles Won - this is a defensive activity that strips the ball from an opponent - so it is a possession lost but not a defensive activity that impedes a successful pass.  It won't be counted as a defensive activity that impedes a successful pass.
  5. Defender Blocks - this is a defensive activity that blocks a shot taken not a successful pass; therefore it won't be counted as a defensive activity that impedes a successful pass.
  6. Blocked Crosess - clearly it is what it is; and since a cross is a pass it will be counted as a defensive activity that impedes a successful pass.

To summarize - Blocked Crosses, Interceptions and Clearances will be counted as defensive activities that should impact the volume of Unsuccessful Passes.

So what are the correlations between those combined Defensive Activities versus Unsuccessful Passes after 142 events?

Final Third Defensive Activities to Unsuccessful Passes = .6864

Final Third Defensive Activities to Unsuccessful Passes when the Defending Activities' Team Wins = .7833

Final Third Defensive Activities to Unsuccessful Passes when the Defending Activities' Team Draws = .6005

Final Third Defensive Activities to Unsuccessful Passes when the Defending Activities' Team Loses = .6378

In conclusion:

It seems pretty clear that Teams who win have more Defensive Activities, that in turn increase their Opponents' Unsuccessful Passes given the higher positive correlation than losing teams - in other words a team that wins generally executes more clearances, interceptions and blocked crosses to decrease the number of Successful Passes their Opponents make.

It also seems pretty clear that all those Defensive Activities don't account for the total of Unsuccessful Passes generated by the Opponent.  If they did then the correlation would be higher than .7833; it'd be near .9898 or so.

So what is missing from the generic soccer statistical community to account for the void in Unsuccessful Passes?

Is it another statistic like Tackles Won, Duals Won, Blocked Shots or Recoveries?

I don't think so - none of them generated a marked increase in the overall correlation of those three Activities already identified.

I think it is the physical and spatial pressure applied by the defenders as they work man to man and zone defending efforts.

In Closing...

To date I'm not aware of any statistics that log 'pressure applied' to the attacking team.  A good way to count that would be tracking how many seconds the defending team gives an opponent when they recieve the ball and take action.

My expectation is that the less time, given the opponent, the more likely they will hurry a pass that simply goes awry without any other statistic event to account for that other than - bad pass due to being hurried.

So in other words; like the NFL tracks hurried passes, I think that the Soccer statistical community should also track "hurried passes"...

I'm not sure that completely closes the gap between those three Defensive Activities and Unsuccessful Passes but it does seem to be a relevant statistic that can attempt to quantify panic in an attacker while also quantifying good physical and spatial pressure by a defender.  Two relevant items of interest to a coach in weighing the balance on who plays and who doesn't and who they might like to add to their team or perhaps put on loan/trade elsewhere.

The Official statistic that would get tracked for attacking players is 'Hurried Passes' and the statistic that would get tracked for defensive players is 'Passes Hurried'.

In addition - an increase in hurried passes can become a training topic that drives a Head Coach to develop tailor made passing or turning drills to minimize Hurried Passes (make space) while also providing a Head Coach statistical information to generate tailor made defensive drills that look to increase Passes Hurried.  I'd expect the level of the training drills to vary given the level of skill/professional development as well.

So how might someone define a "Hurried Pass"?  I'm not sure; there are plenty of smarter people out there in the soccer community than me - if I had to offer up a few suggestions it might be a pass that goes out of bounds given defensive pressure, or maybe a through-ball that goes amiss given pressure from a defender - in other words the timing of the delivery looked bad and given defensive pressure it was off-target.

However defined if judgment can be applied when identifying a pass as a key pass then it stands to reason that judgment can be applied to identify a bad pass as being bad because the defender hurried the attacker.

More to follow...

Best, Chris


Should away teams be more aggressive?

Second Half Shot chart - HOUvPOR - April 2014

The Portland Timbers traveled to Houston on Sunday in desperate need of three points to get out of the cellar in the Western Conference. They played well in the first half, outshooting the Dynamo 8 – 7 en route to a 1 – 1 tie, while dominating possession. Then Portland came out in the second half much like many away teams do with a tie score, conservatively. The second-half shot charts to the right serve as an indication of the change in strategy.  

This conjured up a question that constantly bugs me. Should away teams go for wins more often when tied in the second half? Let's get right to the data. Here is chart summarizing the offensive aggression of away teams during gamestates when the score is tied and the teams are playing with the same number of players. The data presents the proportion of totals earned by the away team in both the first and second halves.

2013-14 Goals xGoals Shots
1st Half 44.8% (266) 42.3% (282.9) 43.4% (2948)
2nd Half 34.8% (184) 37.4% (168.6) 39.7% (1654)
P-value 0.017 --- 0.007

The away team consistently garners 42% to 45% of these primary offensive stats during the first half, and then drops down to the 35%-to-40% range in the second half. For the proportions of goals and shots, those differences are statistically significant (there is no simple test for xGoals%, but it is probably statistically significant as well).

My instinct is that away teams are capable of playing in the second half as they do in the first half, and that these discrepancies are a product of conscious decision making by away coaches and players. Teams likely change strategy in the second half to preserve a tie. Playing more openly would ostensibly increase the chances of both a loss and win, while decreasing the chances of a tie. However, I would think based on the data above that it would increase the chances of a win more so than the chances of a loss. Since a win would earn the away team an extra two points, while a loss would cost it just one, my gut says teams should go for it more often.

Are away teams playing conservatively because mindless soccer conventionality tells them that it's okay to get one point on the road? Is this the self-detrimental risk aversion that plagues coaches in other sports, or are these numbers missing something that could justify the conservative play?

I can't say that I've proven anything, but these data suggest the former.

PWP - Who's Best and Worst after 8 Weeks

Another exciting week in Major League Soccer. Most of the headlines belong to New York, Seattle, DC United and New England as those four teams along with San Jose took 3 points; the instant measurement of success.

Duly noted, but a growing indicator in popularity is Possession with Purpose and the composite difference between how well an MLS team attacks versus defends across the broad spectrum of six key performance indicators in attack.  It's grown enough that after answering my question about Passing Accuracy last Thursday Caleb Porter looked to me, smiled,  and said "Possession with Purpose".

If you're not familiar with those Six Steps here they are in a nutshell:

  1. Possession,
  2. Passing Accuracy across the entire pitch,
  3. Penetration (that percentage of passing a team successfully accomplishes within the Final Third),
  4. Creation of Goal Scoring Opportunities (that percentage of shots taken relative to successful passing within the Final Third),
  5. Putting those shots on goal, and
  6. Goals scored

In case you missed it the relationship of the data points supporting PWP Analysis (after 102 games this year) is very strong regardless of winning, losing or drawing; with the Correlation for Winning being; .9898, drawing; .9827 and losing; .9564.  Click Expected Wins (XpW) to read more...

And if not convinced that this effort is taking hold elsewhere it appears Ted Knutson (@statsbomb) has taken up the gauntlet to see how opponents passing behaviors impact defensive activities in the European Leagues; you may find this article of interest as well.

It will be interesting to see what insights Ted can offer on this; especially given he's got three additional leagues to evaluate.  A great example coming up this week for MLS is the match between DC United and Portland.

DC United average over 18 crosses a game (home and away) playing a Diamond formation (6 of 7 games) - will that pattern continue against Portland or do we see a different defensive approach by Portland to manage (and reduce) that volume of crosses and thereby try to mitigate the strength of Eddie Johnson in the air???  (As noted on occasion by Sir Arthur Conan Doyle --- "The game is afoot" replied Holmes to his loyal companion, Watson.)

With that offered here's how the 19 teams in MLS compare to each other after eight weeks following the PWP guidelines:

PWP Composite Index Through Week 8

The tale of the tape sees Seattle clear the first quarter-mile hurdle ahead of Sporting KC and Colorado.  A strong indication that they are serious contenders for the Shield - and yes you would think so given their position in the Standings and that comprehensive victory against Colorado.

But waiting in the shadows, with three games in hand, is a very potent team called LA Galaxy; nine points from those three games in hand puts them atop the West.  And of note is that LA currently have the best PWP Composite Index of any team in MLS.

Can you hold your breath until July 26th when these two teams meet for the first time on National TV?  And how about the last two games of the regular season - back to back Nationally televised games again... wow......

Talk about a story-line; and all that coming after the World Cup...

But back to the basics; DC United took great advantage of Zach Loyd and his 2nd Yellow (Red Card) in the 39'th minute; scoring four goals and icing the game with Fabian Espindola's second from an assist by Chris Rofle.

While I didn't see the game I did get to watch the MLSSoccer.com recap here...  seems a bit dubious that two yellows like that would garner a Red Card but on the first one Loyd was clearly out of position and his pulling back Espindola warranted a Yellow given how tight the Referee's have called games this year.

As for the second - well - any time you go studs up into a tackle you deserve a Yellow; shame on Loyd for two Yellows... and like Collin (Sporting KC) he put his team at a distinct disadvantage...

Other teams making moves this week included San Jose beating a woeful Chivas while Houston dropped two points by drawing, at home, to Portland. 

What was interesting to me about that game was how pedestrian, at times, the possession for Portland was.  Clearly there is an attempt by Caleb Porter to resurrect the successful possession based approach leveraged last year.

If a player like Gaston Fernandez can pair up more readily with the likes of Valeri and Nagbe then the Rose City should begin to feel better.  A great test comes this next weekend as they entertain another possession based team, DC United.

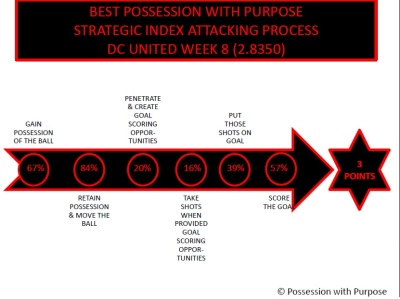
PWP Attacking Team of the week:  DC United


PWP Attacking Team of Week 8

DC United had a superb 84% completion rating in Passing; much no doubt do to Loyd being sent off before the first half.  But hey, if you can't dominate a team when they are a man down then you're not a good team... DC United proved they were good this weekend and proved it in style.

As for Seattle; sadly they had to play against an 11 man Colorado.  If not it is likely they would have scored 6 or 7 goals against the Rapids...

Mastroeni will need to work his back-four hard as they prepare for LA this weekend.

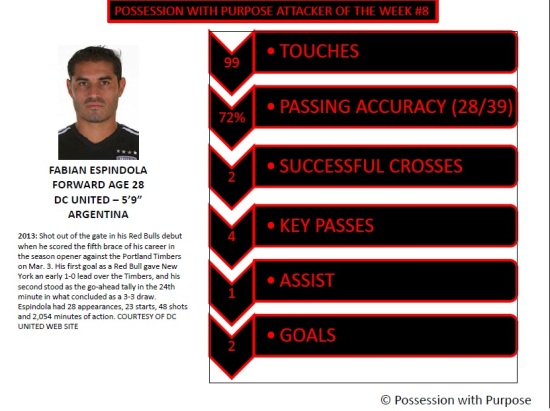
PWP Attacking Player of Week 8: Fabian Espindola

PWP Attacking Player of Week 8

Pretty comprehensive as Espindola took great advantage, as did his teammates, with Loyd's poor performance...

Another player getting big headlines this weekend was Clint Dempsey.  Here's how Clint lined up playing against the full strength Rapids:  99 touches, 55/59 (93% passing accuracy), 2 Key Passes and 2 Goals.  So a great game for Dempsey and a solid indication that his run of play over the last 3-4 games has been superb...

Other notable team attacking performances this week saw New York completely blast Houston 4-nil; that is two games running where New York matched or exceeded their PWP Index rating for last year - is it any wonder they've won the last two games?

As for bottom dwellers, Philadelphia was the only team in the bottom four without a Red Card; worst of the bunch this past week also included Chivas, Sporting KC, and FC Dallas.

Maybe it's just me but another reason why a team's Index shouldn't double count the impact of a Red or Yellow Card - when players get booked (regardless of red or yellow) does it impact overall team PWP performance?  I think so, and I'll look into that at the half-way point of the season.

I'll look at teams that lose with and without players that got booked; not sure what I'll find out but it should be interesting to see if it can be quantified to some extent.

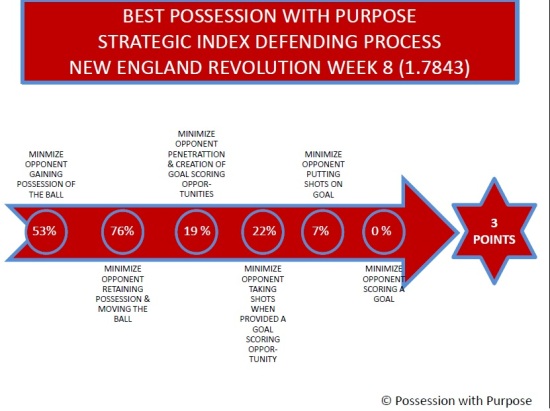
PWP Defending Team of Week #8:  New England Revolution

PWP Defending Team of Week 8

A clean sheet is a clean sheet and so on... shutting out Sporting is probably easier at home than on the road - the rematches will be big games and Collin is probably pretty narked for that Red Card.  We shouldn't be surprised though; he's traditionally untimely in his tackles and with Opara (still injured?) Vermes may be hard pressed to find a suitable replacement.

Anyhow - the top play here was the back-four for New England shutting down Dwyer and Zusi... well done and not a surprise...

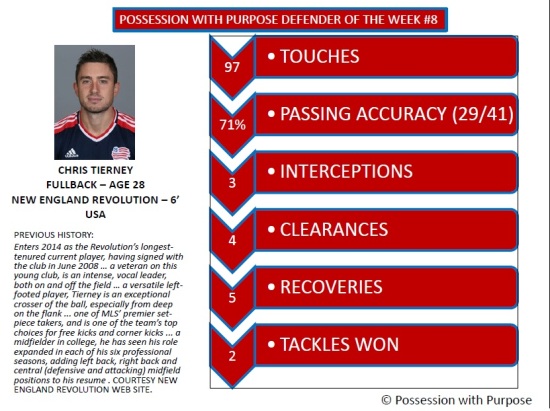
PWP Defending Player of Week 8: Chris Tierney


PWP Defending Player of Week 8

The toughest pick I had this week was selecting which defender got the award; both AJ Soares and Chris Tierney stood out over the others.

AJ offered up these defending attributes... 30 of 38 in passing for 79% accuracy, 69 touches, 1 tackle won, 2 blacked shots, 2 interceptions, 6 clearances and 3 recoveries.  Pretty close to the same outputs by Tierney - more appropriate though was the fact that the two of them partnered on the Revolution defensive left side, in their own final third in stopping 12 of 38 passes by Sporting KC.

In my view Tierney and Soares were far more productive for their team this weekend than Farrell - this isn't the first time my PWP Players or teams don't match what comes out of MLSSoccer.com - different views offer different outputs... both have value.

Congrats to San Jose for their clean sheet and kudo's for Montreal winning a game that a switched-on Union should have won hands down... wow - what a surprise that outcome was!

Stay tuned for my PWP-Pick-List Week 9;  I'm at 44% success rate and I took a clean hit across the cheek when Montreal and New England took three points while Real Salt Lake gave away two points in that complete melt down against Vancouver.... my, oh my, oh my...

Best, Chris


Expected Wins in MLS

Over the two and a half years I've been developing Possession with Purpose you've heard me go on about this game not just being about scoring goals it's about winning.  I don't mean that in the sense that you don't need to score goals to win; you do.  But what separates winning from losing statistics wise?  And if there is separation, what is it, and what value does it bring?

I'm not sure I have 'the' answers but I do have 'some' answers...

To begin here are the 7 primary data points I collect and calculate ratios with in my PWP Six Step Process analysis:

  1. Passes Attempted Entire Pitch
  2. Passes Completed Entire Pitch
  3. Passes Attempted Final Third
  4. Passes Completed Final Third
  5. Shots Taken
  6. Shots on Goal
  7. Goals Scored

I collect these data points for every team, for every game; all 646 from last year and up to 102 (61 Games) so far this year.

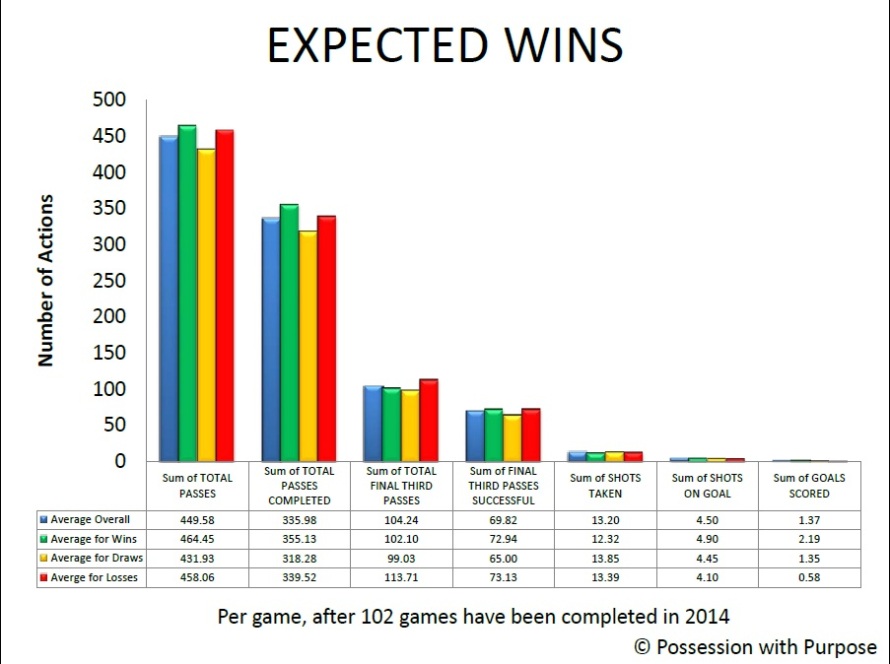
In looking at the data this year the below diagram offers up the averages of those 7 data points, for all games, up to the end of Week 6. 

The blue bar is the overall Average for all games regardless of points earned, the green bar is the Average for all games where teams took three points, the amber bar is the Average where teams took one point, and the red bar is the Average where teams got nil-pwa.  

Expected Wins PWP Data Points

Facts as they exist today after 102 games in 2014:

The table just beneath the bar graph indicates the raw numbers (averages); for example the average Successful passes for teams that lose (in the Final Third) is 73.13; their average Shots taken is 13.39; their average Shots on goal is 4.10 and their average Goals scored is .58.

Here are the percentages derived by comparing the relationship of each of these points(part of my PWP analysis) working left to right:

  • Teams that win average 50.30% Possession versus teams that lose average 49.70% Possession.
  • Teams that win average 76% Passing Accuracy across the Entire Pitch. /// teams that lose average 74% Passing Accuracy across the Entire Pitch.
  • Teams that win average 71% Passing Accuracy in the Final Third. /// teams that lose average 64% Passing Accuracy in the Final Third.
  • Teams that win average 22% of all their Passes Attempted in the Final Third /// teams that lose average 25% of all their Passes Attempted in the Final Third.
  • Teams that win average 17% Shots Taken vs Completed Passes in the Final Third. /// teams that lose average 18% Shots Taken vs Completed Passes in the Final Third.
  • Teams that win average 40% Shots on Goal vs Shots Taken. /// teams that lose average 31% Shots on Goal vs Shots Taken.
  • Teams that win average 45% Goals Scored vs Shots on Goal. /// teams that lose average 14% Goals Scored vs Shots on Goal.

Observations:

While 2% difference in overall Passing Accuracy might not mean much it should be noted as a reasonable indicator on how well a teams' Passing Accuracy will be in penetrating the Final Third.

That 2% difference translates this way.  When a team makes 500 pass attempts.  76% * 500 Passes equals = 380 Completed Passes.  74% * 500 Passes equals 370 Completed Passes.

Any one of those unsuccessful passes could be the pass that gets you that goal or leads to the Opponent making an interception (quick counter) that gets them a goal.

Perhaps it is easier to understand why some coaches say control of the game and possession adds value?  Those teams that are more accurate in their overall passing are more likely to win.

In looking at Passing Accuracy within the Final Third there is a clear difference between winners and losers; winning teams are 9% better in Passing Accuracy within the Final Third... this is not about volume of passes - it's about the accuracy of those passes.

To put that into perspective say a team attempts 100 passes in the Final Third; 71 of those passes (71%) are successful for the winning team whereas  only 64 (64%) are successful for the losing team.

That difference of 7 (within the tight confines of the Final Third) could make a BIG difference; those 7 extra completed passes could be 7 through-balls, key passes, or crosses that lead to a goal versus no goal.

Note that losing teams take more shots (on average) per pass completed (18%) than teams that win (17%).

Is that an indicator that the less effective team is trying to compensate for lower skill levels/overall passing accuracy by increasing their shots taken totals?  I think so.

And when looking at the ability of a winning team to put a shot taken on goal (a more accurate shot) the winning teams do that 9% better than losing teams.

And that initial accuracy then translates to a huge, if not inordinately large, difference between a team that wins versus loses; 45% of shots on goal are goals scored for winners versus 14% for losers.

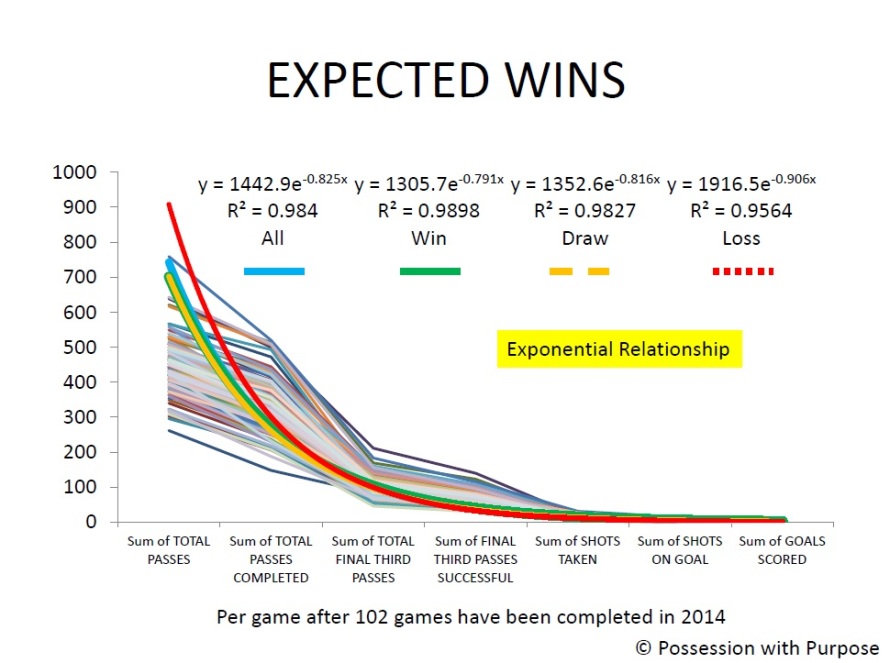
Now for the second diagram and the R2 for the overall average, wins, draws, and losses with the backdrop lines being the real numbers for all 102 games this year..

The "x and y" axis represent the same things as they did in the first diagram.  The Blue, Green, Yellow and Red lines represent the averages 'in trend-line format' seen in the above diagram with their corresponding exponential correlations.  

I selected the Exponential Relationship as opposed to a Linear Relationship because I think it best represents the drop off in passes (in total) versus those just within the Final Third; the R2 will remain the same regardless.


Expected Wins PWP Data Points Correlations

Observations:

First off - all those lines are the 102 games worth of data that populate the diagram - it is that data that also formed the 'averages' for the first diagram...

That tight difference in R2 means there is a very tight margin of error between winning, losing and getting a draw; and if you've watched a game you know a single mistake can cost you three points.

However tight, there is a difference between the R2 for winning teams versus losing teams.  Is that statistical difference associated with those percentage differences indicated in the first diagram?

I think so, and while Possession (itself) is not "the" prime indicator on whether a team wins or loses it is "an" indicator that should be considered, when viewing overall passing accuracy within and outside the Final Third.

Perhaps the TV pundits will take more time to show better graphics where the Final Third data (in possession percentage) is separated out from the overall possession data?

Perhaps another view that may be helpful to others is the 'space available' that gets leveraged in creating that goal scoring opportunity?

I don't know if this data is representative for teams in Europe - but the data certainly supports that view for teams in Major League Soccer.

To reinforce the End State (winning) from a different viewpoint. 

Last year the top five teams in volume of shots taken versus passes completed in the Final Third were Chicago, (26%), Philadelphia (26%), FC Dallas (26%), Montreal (25%) and Columbus (23%).

Only one of those teams made the MLS Playoffs - Montreal.

This year the top three teams with the highest volume of shots taken versus passes completed in the Final Third are Montreal (28%), Chicago (28%) and San Jose (26%); two of those three teams are the current bottom dwellers in the Eastern and Western Conferences.

In all this I've not talked anything about defensive play... more later this year on how teams perform without the ball with specific focus on defensive efforts (collectively and by individual defensive action) within the Final Third.

For now I offer these questions:

  • Do you think teams that defend better do so as a team (collectively) or is it individual actions like clearances, tackles, interceptions or recoveries that stand alone?
  • And does the general formation they play to (advertised as 'the formation' in the MLS recaps) show results differently in how a defense performs?
  • And does the relationship of the individual or collective defensive activities relate better to unsuccessful passes in the Final Third?

My intent will be to answer these questions, and more, as the data piles up (figure once the 17 game mark is reached, for most MLS teams, I will have enough to offer a reasonable view on what is and isn't of value.  With respect to the data discussed here - I have the 102 games here and the 646 games from last year.

When circling back to my overall PWP Composite Index - here it is put another way...

  • The Attacking Index is the relationship those seven data points have with respect to the six steps in the PWP Process.
  • The Defending Index is the relationship the Opponents seven data points have with respect to the six steps in the PWP Process.
  • The Composite Index is the difference between those two Indices.
  • This year, at this time, the overall Correlation of that analysis is an R2 of  .7658 - the R2 for Goal Differential is .8729.
  • The R2 for Goals Scored is .5083 and the R2 for Attacking PWP is .5865
  • The R2 for Goals Against is -.6754. and the R2 for Defending PWP is -.6225
  • Bottom line here is that the PWP Composite Index has the 2nd highest R2.  With that you should have a better feel for what goes on behind the scenes to get there as opposed to just looking at Goal Differential.
  • The more data points collected the more relevant the R2.
  • How this plays out by the end of the season is unclear but as a reminder the overall PWP Composite Index was 90% accurate by the end of the 2013 in showing what teams would make the playoffs and what teams wouldn't.
  • And two of the top three teams in the Composite PWP Index for 2013 were in the MLS Championship Finals...
  • Starting for Week 8 my PWP-Pick-List will offer up my prognostications about a team either winning or losing... no more draws will be offered up as no one team ever goes into a regular season game wanting to get a draw.  A draw is good but the intent of a Head Coach is to win first.

In closing...

The repeatable statistic in this effort is wins, draws and losses...

Expected Wins is all about what it generally takes to win a game versus lose a game; it's not about getting a draw.

Expected Goals is an 'effect' relative to Expected Wins and the 'causing' relationship between those seven data points; i.e. the combined effort of a team as it possesses, passes and penetrates with purpose.  Hence my phrase offreed up some time ago "quality beats quantity".

And yes, set-pieces win games, and sometimes the team getting those and scoring from those does that against the run-of-play; I suppose that is why the R2 for wins, draws, and losses is so close.

However viewed, teams play to win and score goals.  Various strategies and tactics may be used depending upon location, game state, game conditions, team formations, player selections, or what's needed to move on, if in a knock-out or other tournament type condition.

It will be interesting to see how this analysis unfolds for the World Cup this year... more to follow... Here is the link on more to follow for MLS this year... Expected Wins 2 (92 games /// 184 events)

Bottom line at the Bottom:  For the MLS, every team wants to win every game - those teams that are more successful in winning are those teams that:

  1. Have slightly more possession,
  2. Have better passing accuracy, 
  3. Have more patience in penetrating the Final Third,
  4. Take slightly fewer shots,
  5. Put more shots on goal and,
  6. Score more goals.

Best, Chris